
Biological Clocks in Mosquitoes
Brian Taylor
|
List of Figures
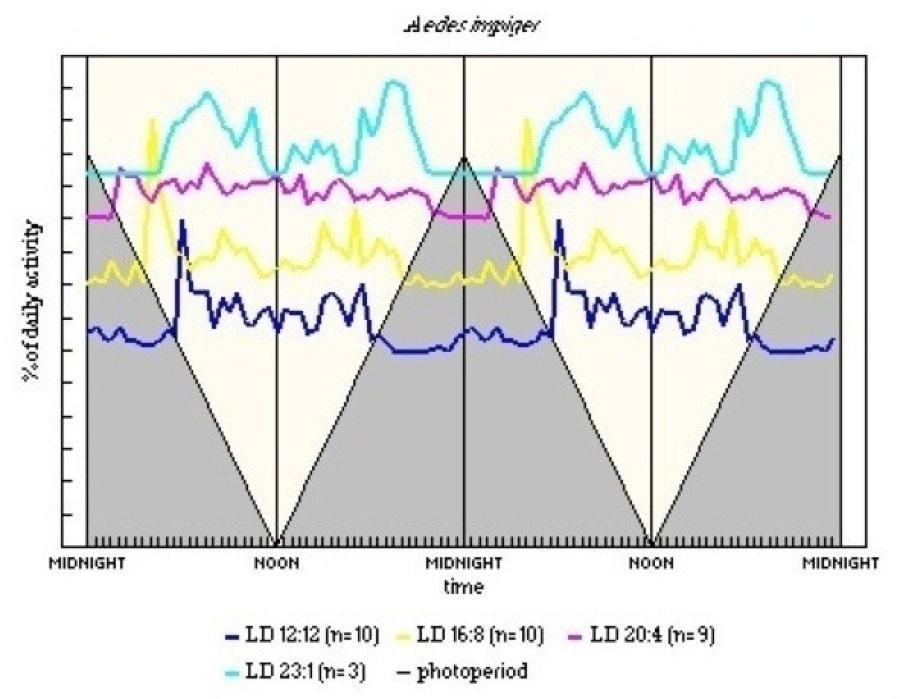
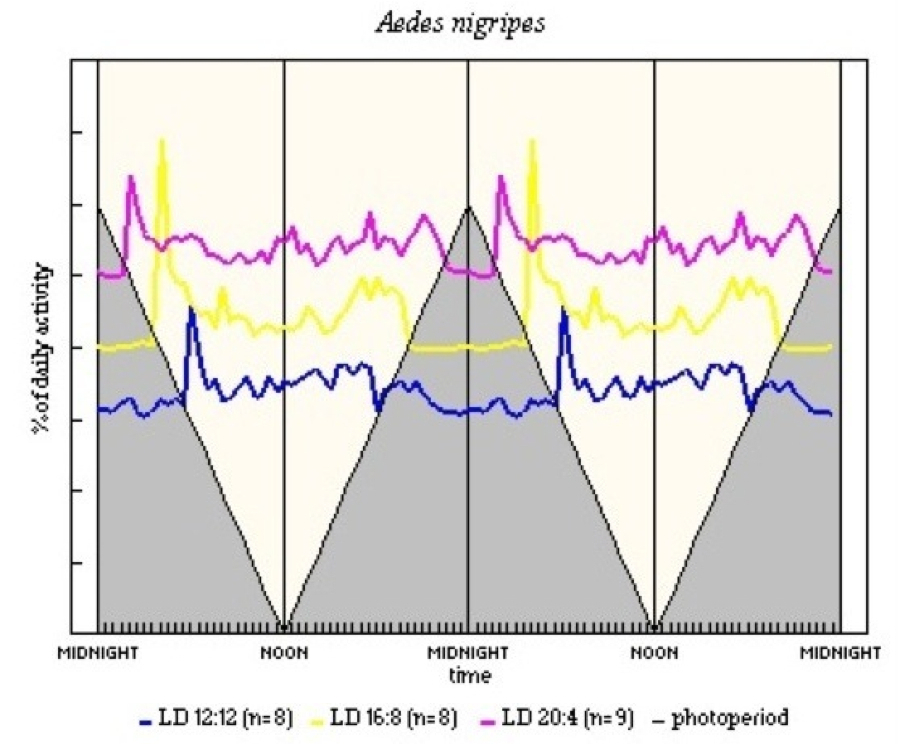
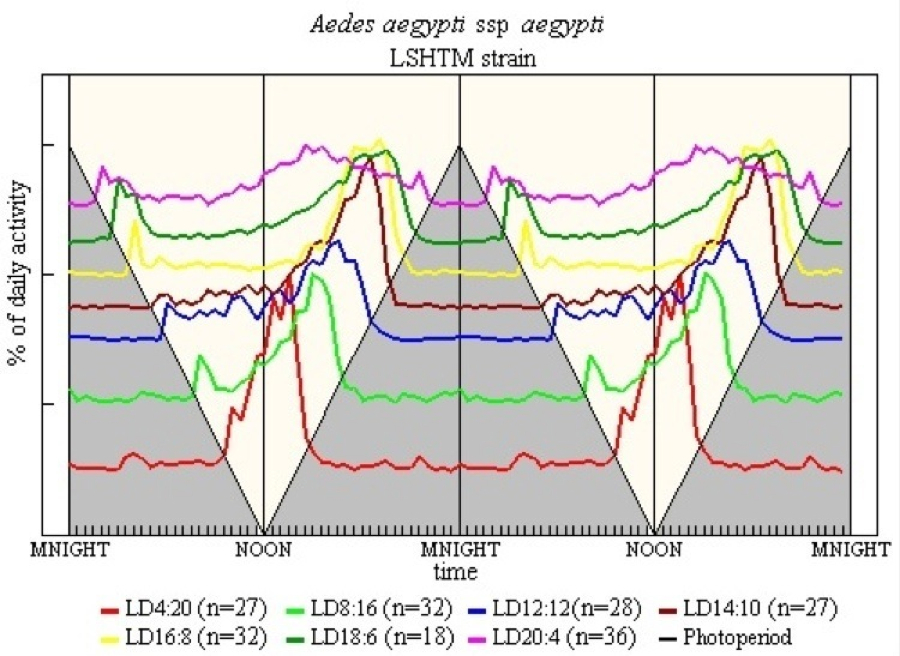
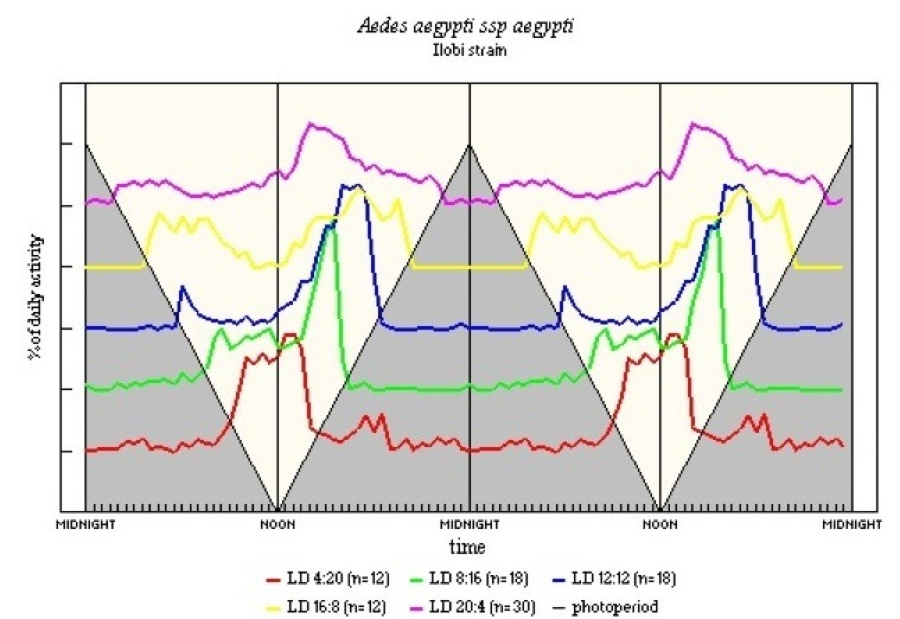
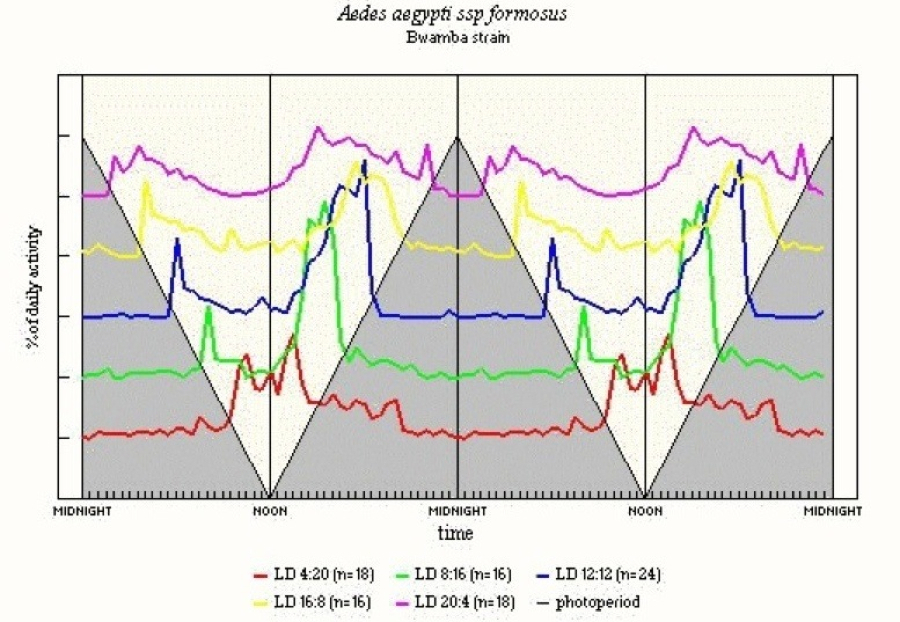
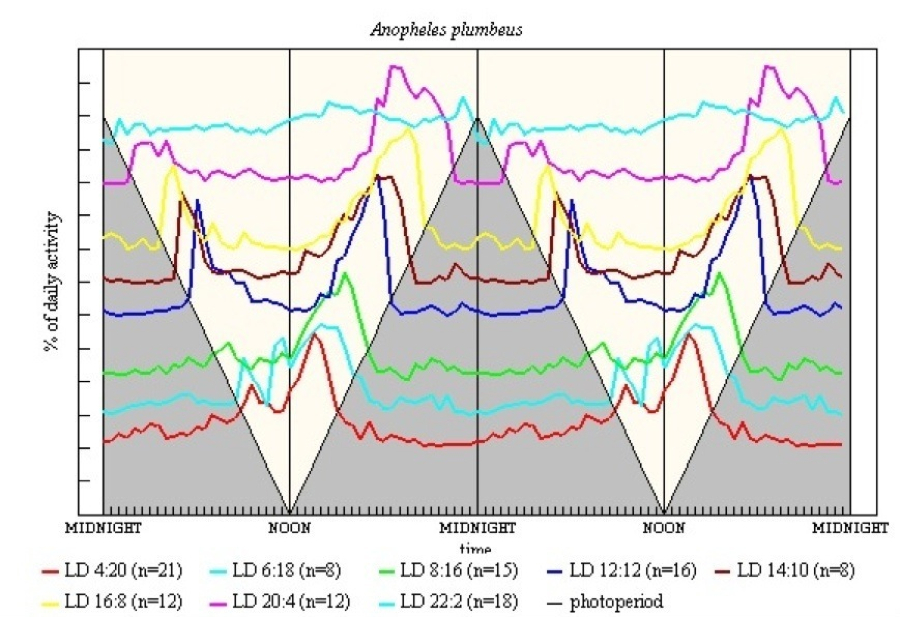
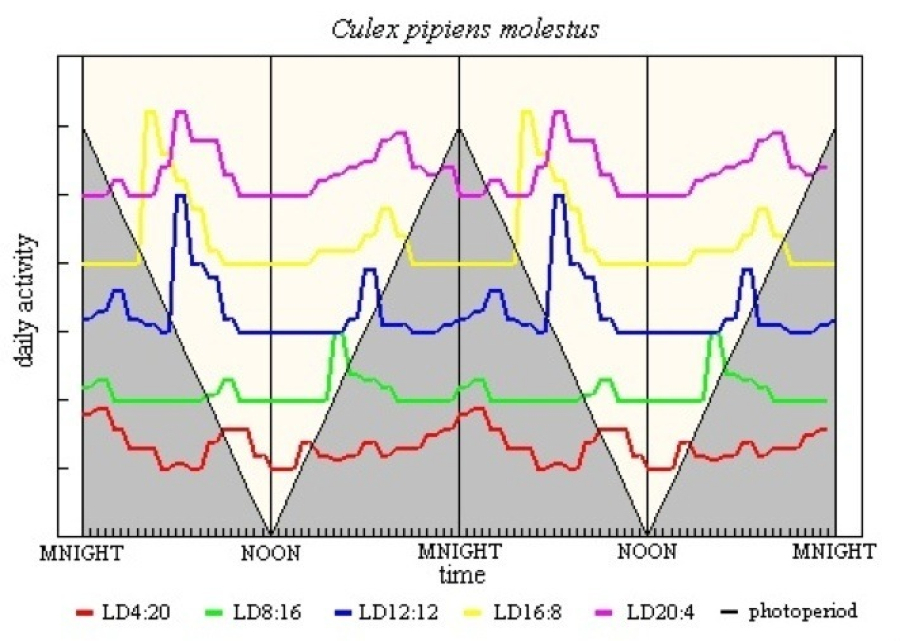
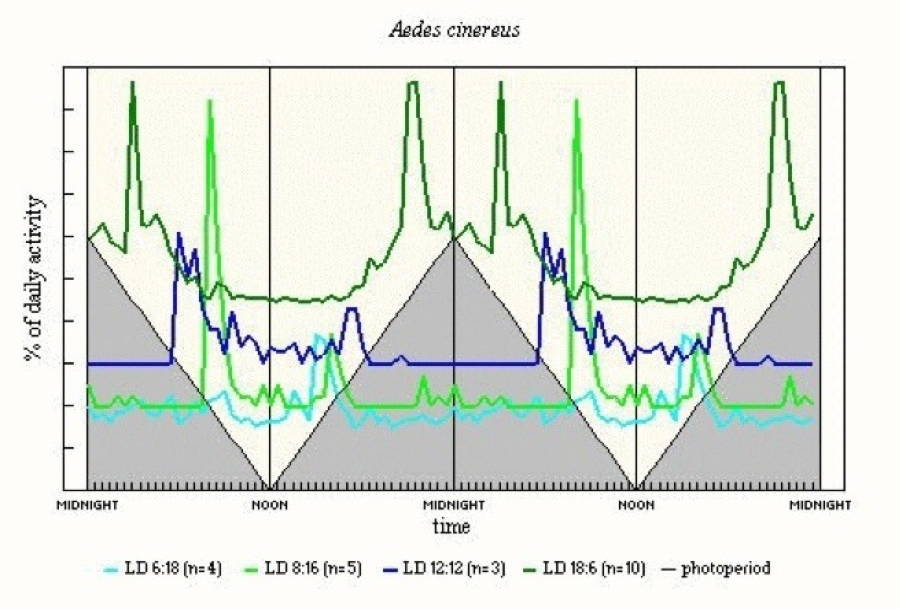
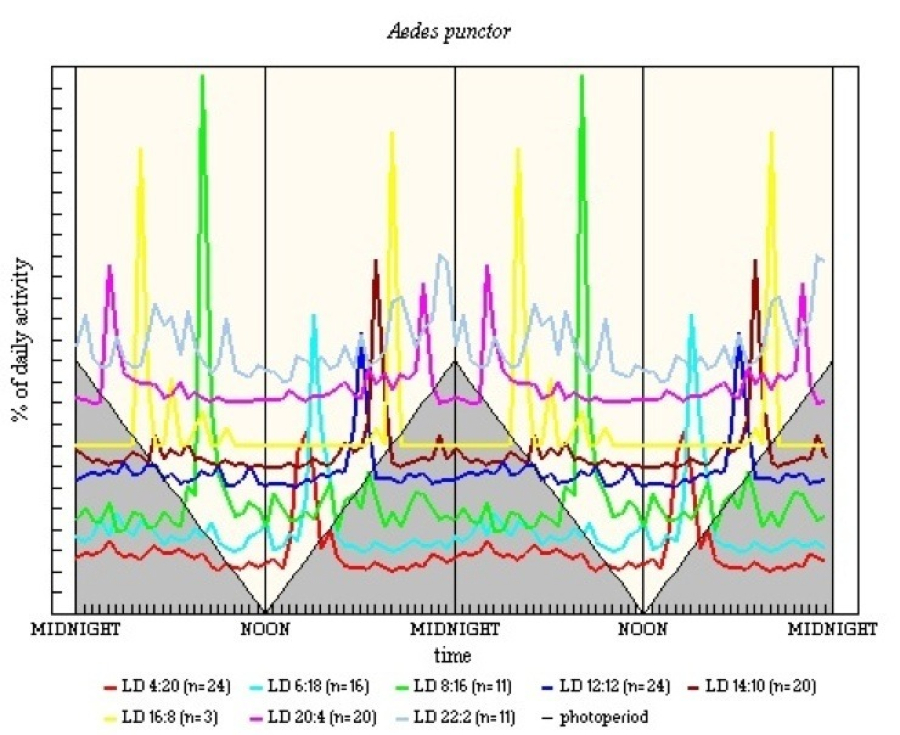
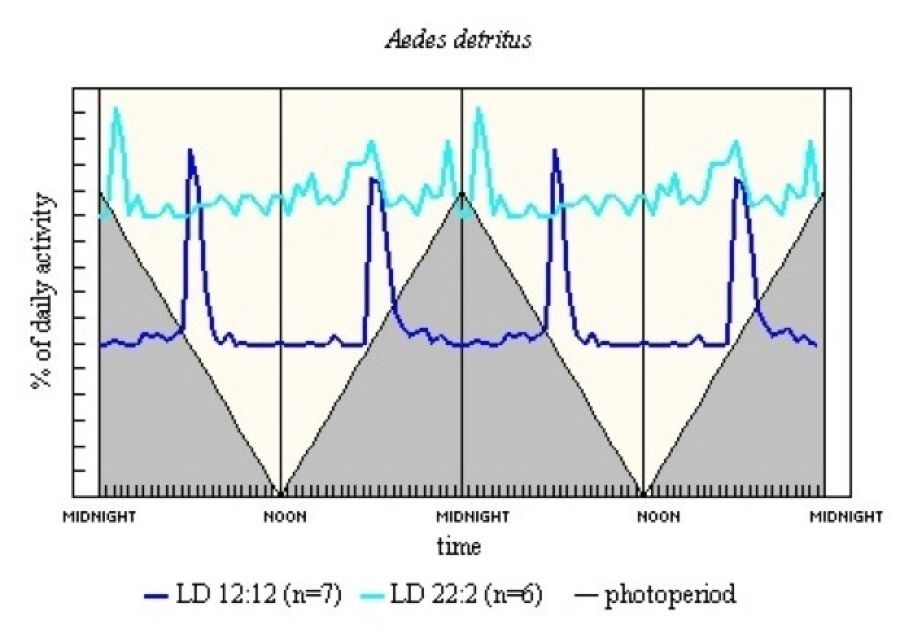
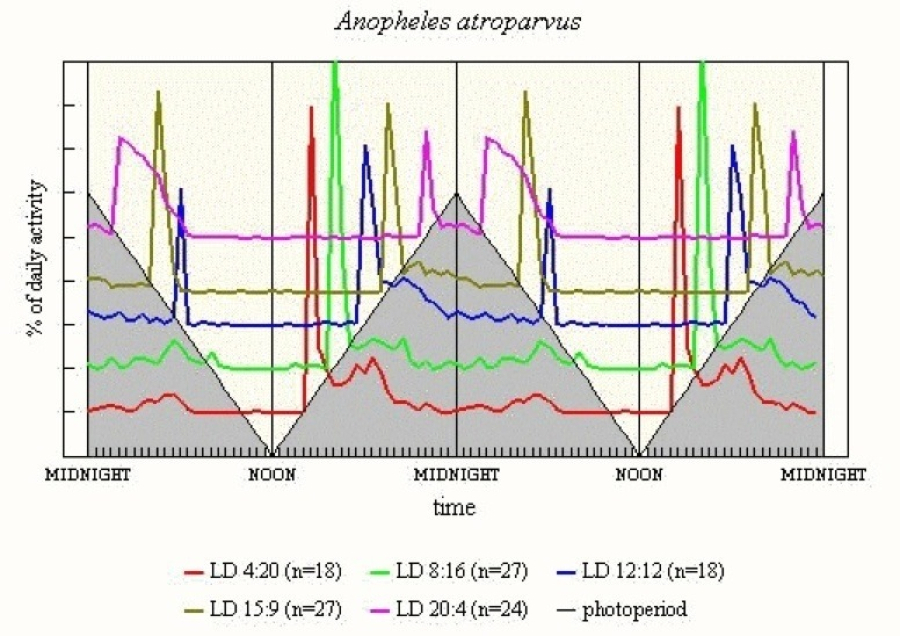
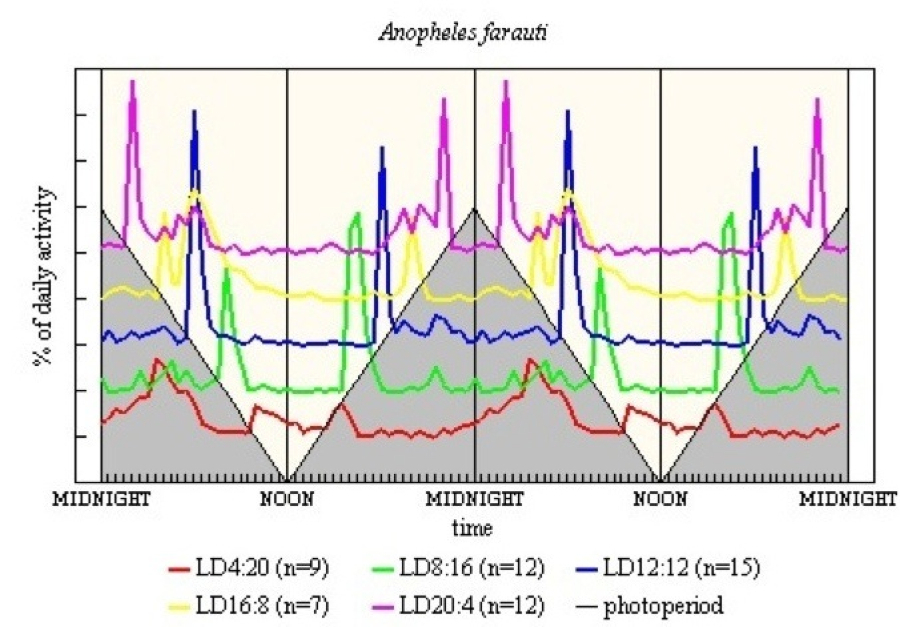
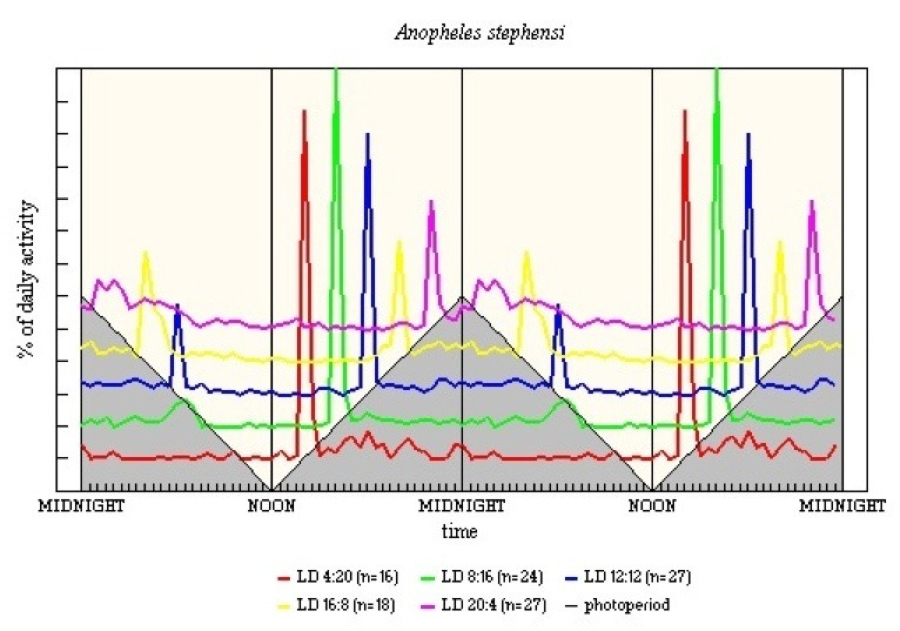
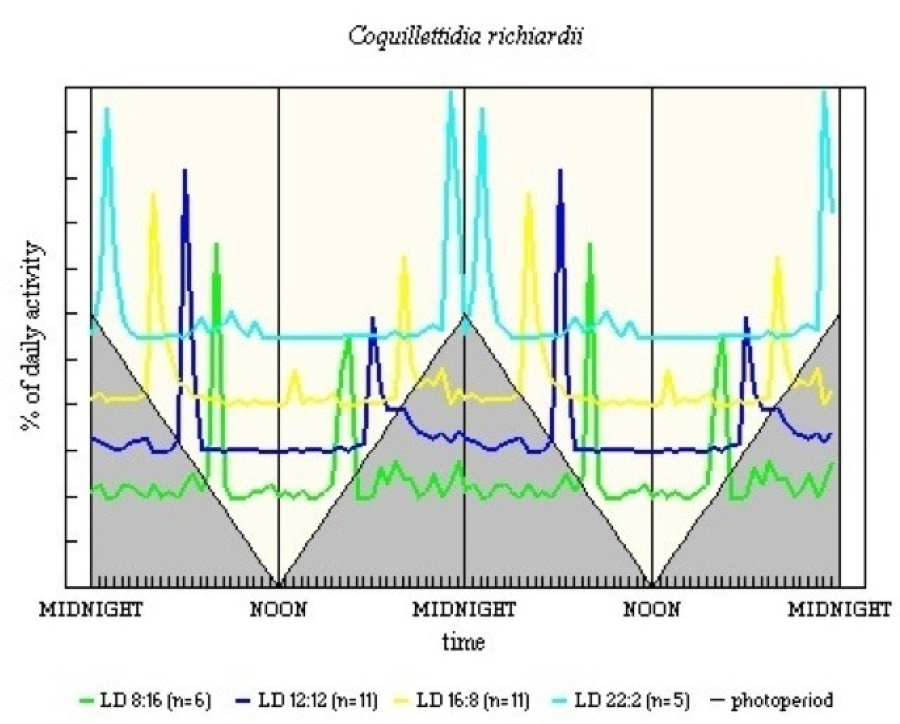
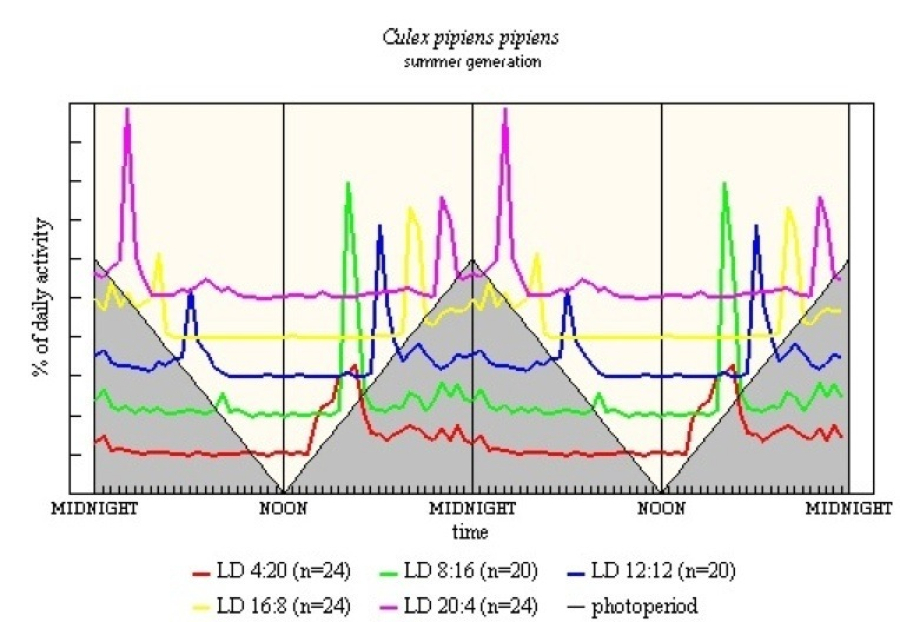
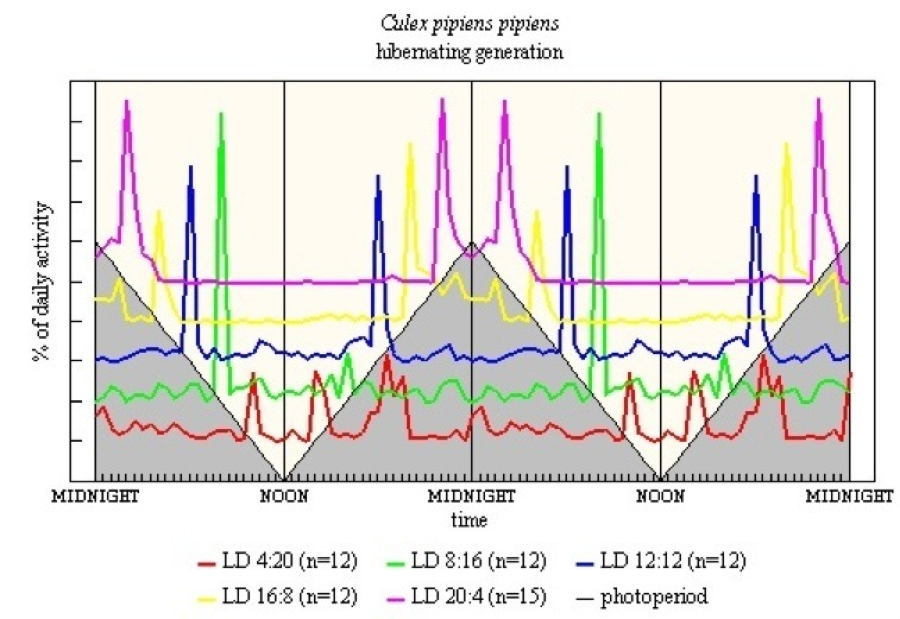
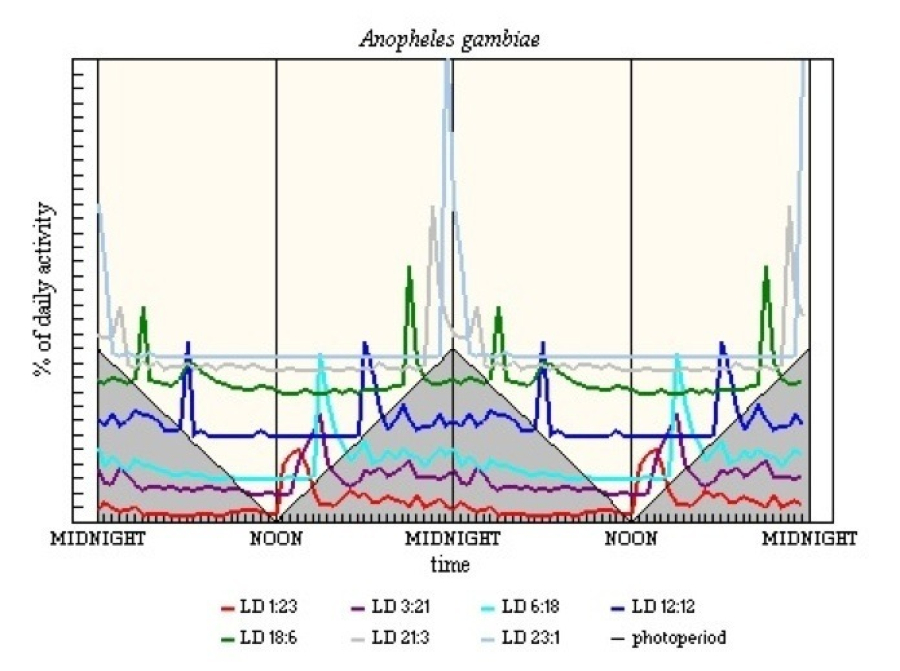
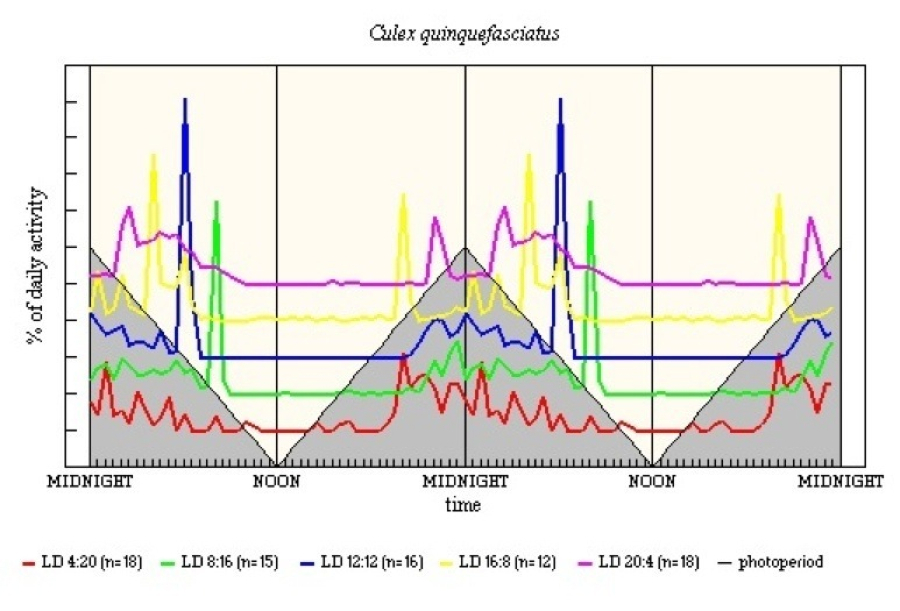
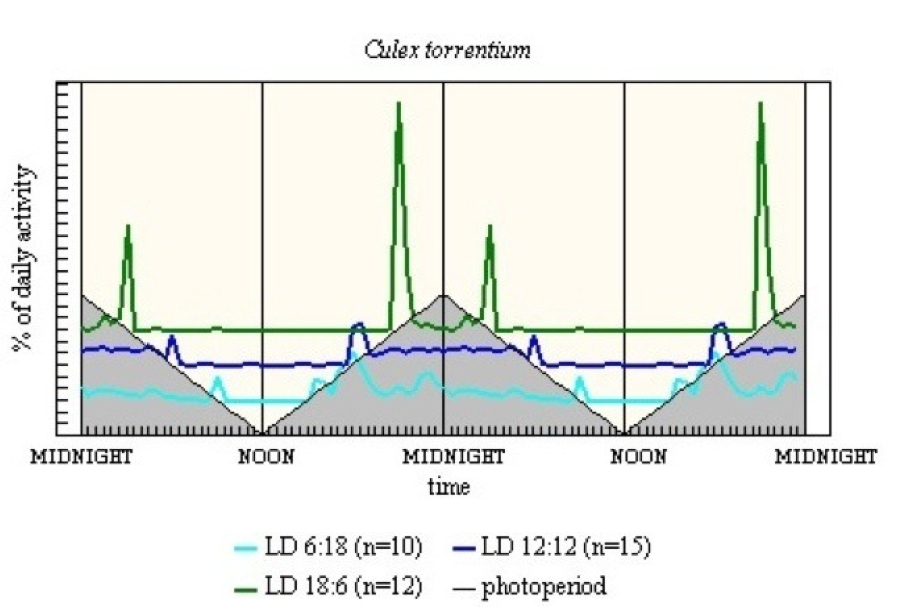
Section 1 - Photoperiodograms. Each is a double plot of the 24-h
cycle, showing % of the daily activity in each half-hour. Each
experimental LD regime is plotted along the appropriate lateral, with
the photoperiod being L = 0h at the base and L = 24h at the top. The
number of mosquito-days of recording, n, from which the mean % activity
was derived is shown for each LD.
- Figure 1 Photoperiodogram of Aedes
impiger flight activity.
- Figure 2 Photoperiodogram of Aedes
nigripes flight activity.
- Figure 3 Photoperiodogram of Aedes
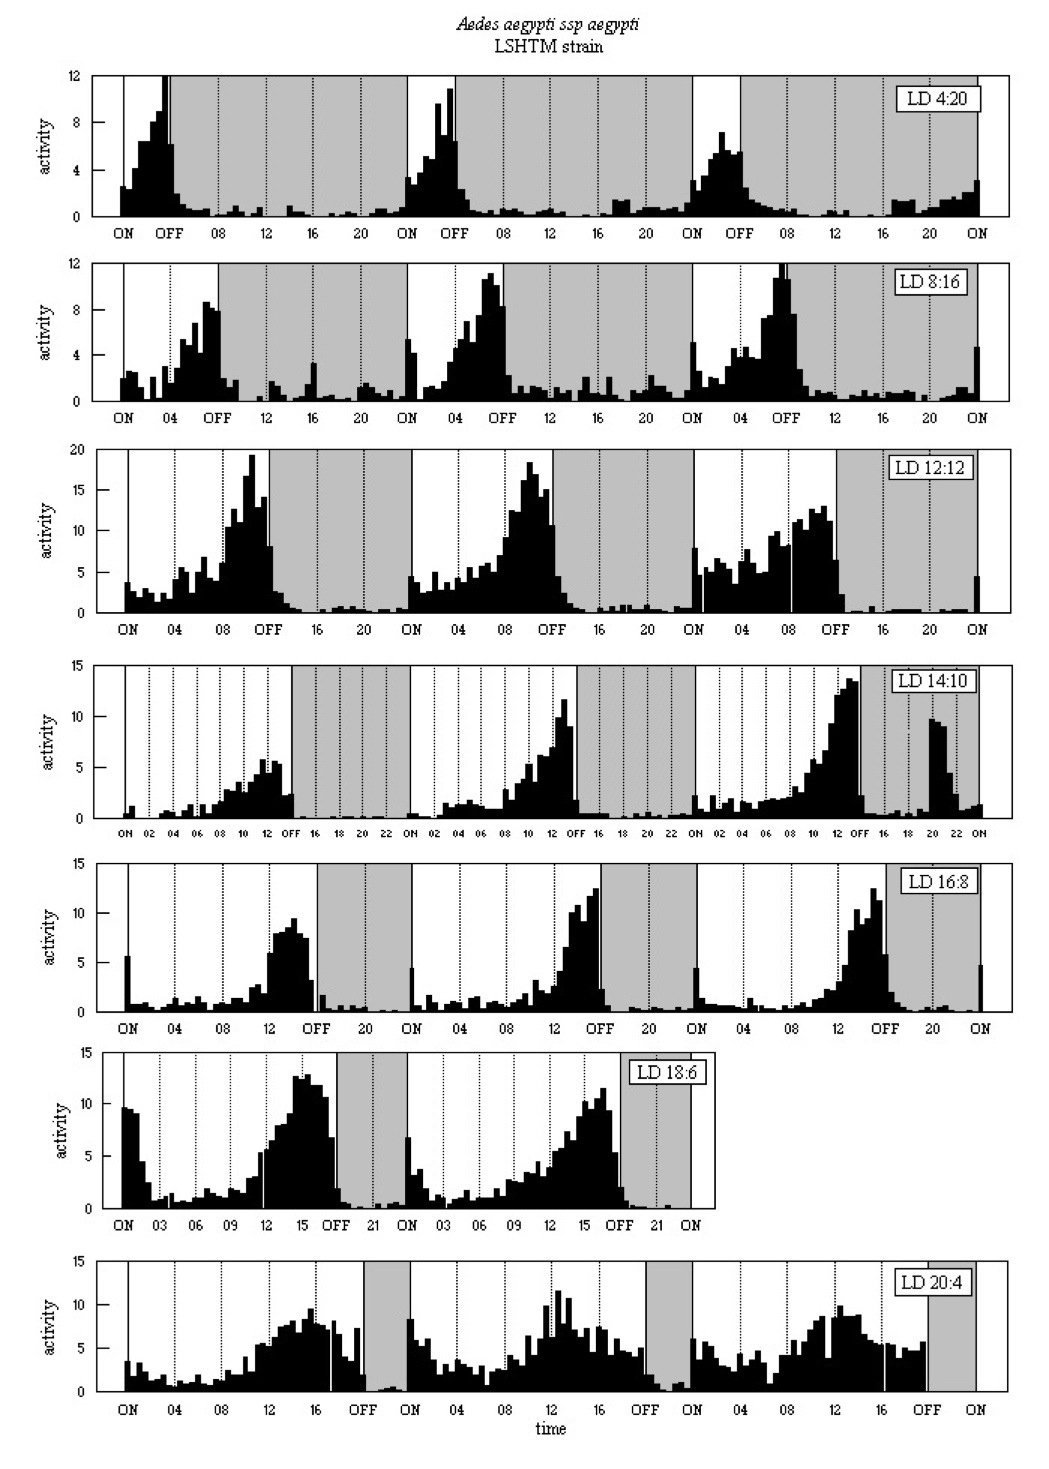
aegypti, ssp. aegypti LSHTM strain, flight activity.
- Figure 4 Photoperiodogram of Aedes
aegypti, ssp. aegypti Ilobi strain, flight activity.
- Figure 5 Photoperiodogram of Aedes
aegypti, ssp. formosus Bwamba strain, flight activity.
- Figure 6 Photoperiodogram of Aedes
aegypti, ssp. formosus West Nile strain, flight activity.
- Figure 7 Photoperiodogram of Anopheles
plumbeus flight activity.
- Figure 8 Photoperiodogram of Culex
pipiens molestus flight activity. Simplified graph derived from
Chiba & Tomioka (1992), activity shown per hour.
- Figure 9 Photoperiodogram of Aedes
cinereus flight activity.
- Figure 10 Photoperiodogram of Aedes
punctor flight activity.
- Figure 11 Photoperiodogram of Aedes
detritus flight activity.
- Figure 12 Photoperiodogram of Anopheles
atroparvus flight activity.
- Figure 13 Photoperiodogram of Anopheles
farauti flight activity.
- Figure 14 Photoperiodogram of Anopheles
stephensi flight activity.
- Figure 15 Photoperiodogram of Coquillettidia
richiardii flight activity.
- Figure 16 Photoperiodogram of Culex
pipiens pipiens, summer generation, flight activity.
- Figure 17 Photoperiodogram of Culex
pipiens pipiens, hibernating generation, flight activity.
- Figure 18 Photoperiodogram of Anopheles
gambiae flight activity. Data derived from Jones et al. (1972).
- Figure 19 Photoperiodogram of Culex
pipiens quinquefasciatus flight activity.
- Figure 20 Photoperiodogram of Culex
torrentium flight activity.
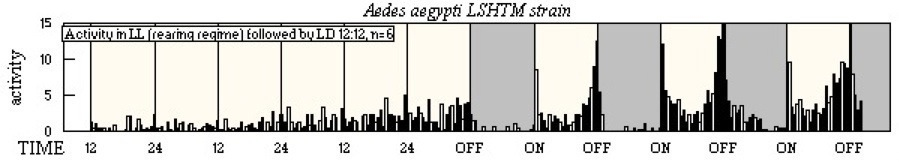
Section 2
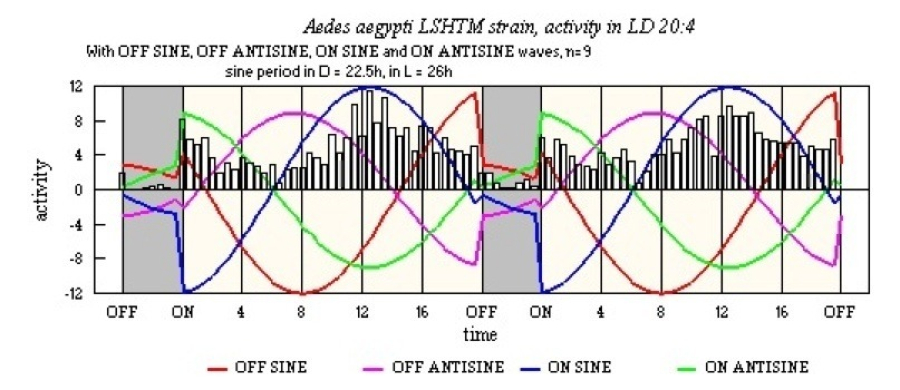
In all graphs details are given the label boxes and the sine waves
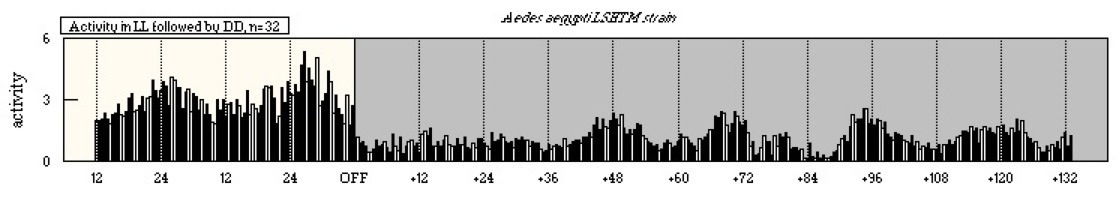
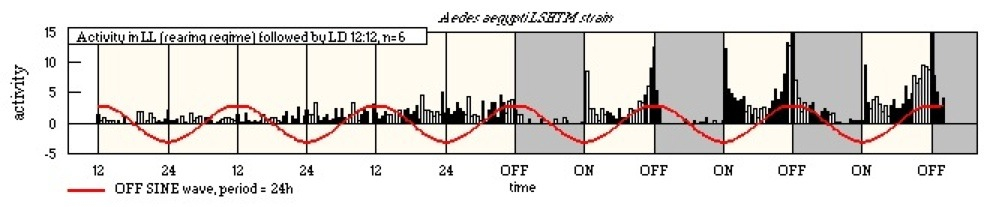
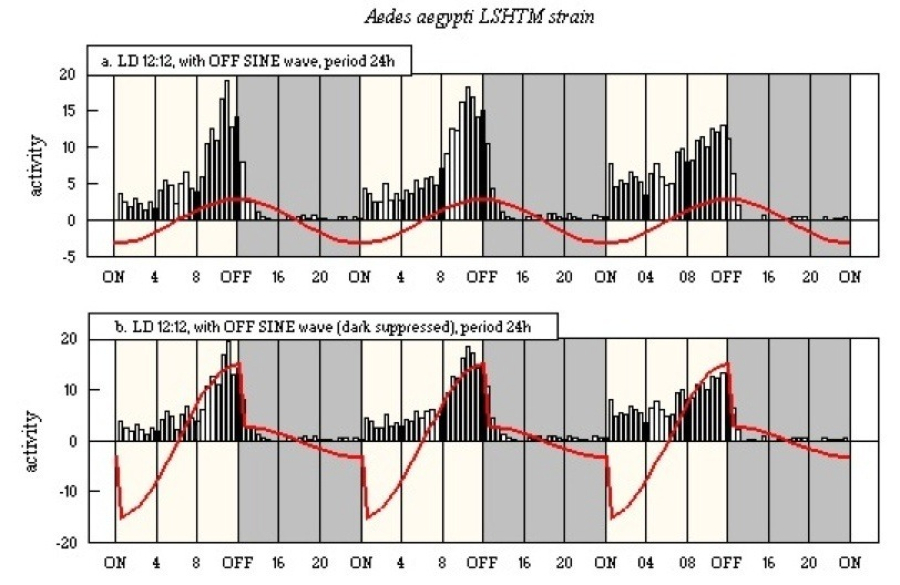
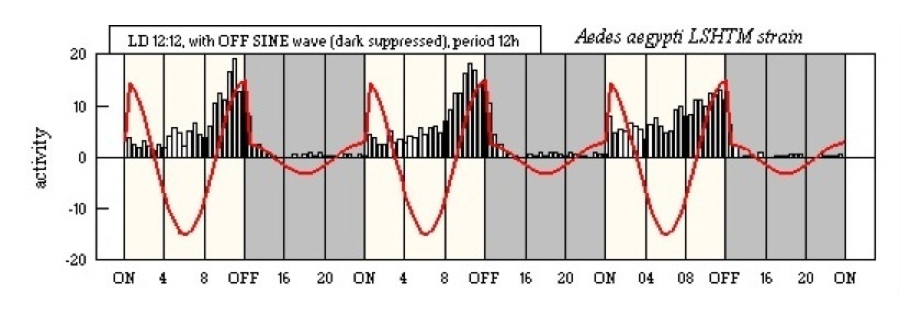
explained in the appropriate text. The Y-axis shows the mean score per
half-hour (maximum 30) for the flight activity of several individuals
(n) and the time scale (X-axis) is divided into half-hour intervals.
- Figure 21 Aedes aegypti, ssp. aegypti
LSHTM strain, the rhythm of activity in LD 12:12 following
rearing in LL.
- Figure 22 Aedes aegypti, ssp. aegypti
LSHTM strain, the rhythm of activity in LL followed by DD.
- Figure 23 Aedes aegypti, ssp. aegypti
LSHTM strain, the rhythm of activity in LD 12:12 following
rearing in LL and a possible oscillator sine wave (OFF SINE).
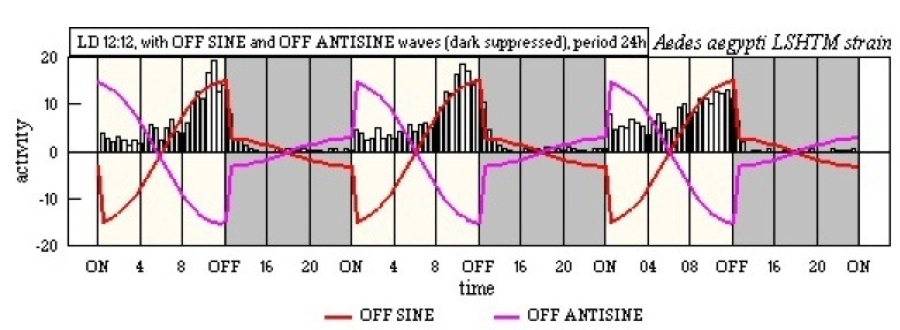
- Figure 24 Aedes aegypti, ssp. aegypti
LSHTM strain, development of sine wave concept, showing
modulation of OFF SINE by dark suppression.
- Figure 25 Aedes aegypti, ssp. aegypti
LSHTM strain, development of sine wave concept, showing OFF
SINE with a period length of 12 h, plus modulation by dark suppression.
- Figure 26 Aedes aegypti, ssp. aegypti
LSHTM strain, development of sine wave concept, by addition of
the OFF ANTISINE.
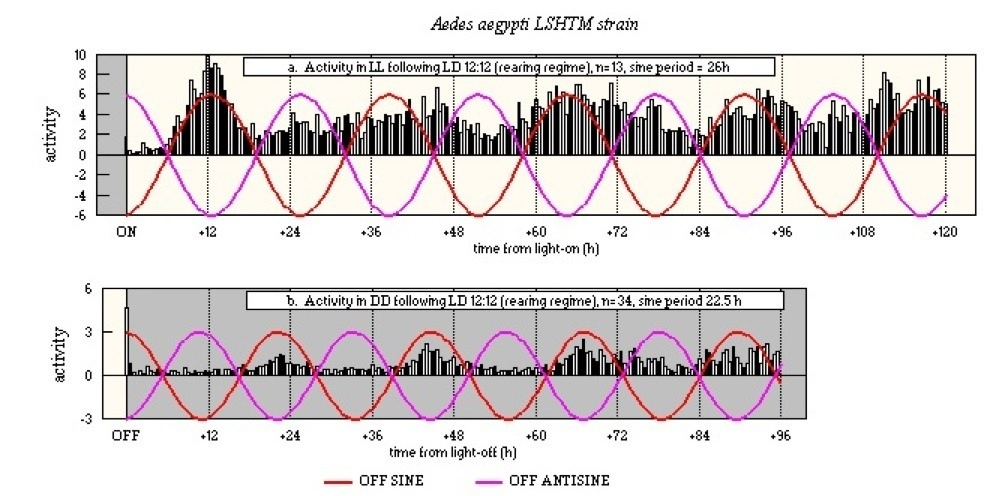
- Figure 27 Aedes aegypti, ssp. aegypti
LSHTM strain, activity in LL and DD, with application of OFF
SINE and OFF ANTISINE sine waves of differing periodicity (26h in LL
and 22.5h in DD).
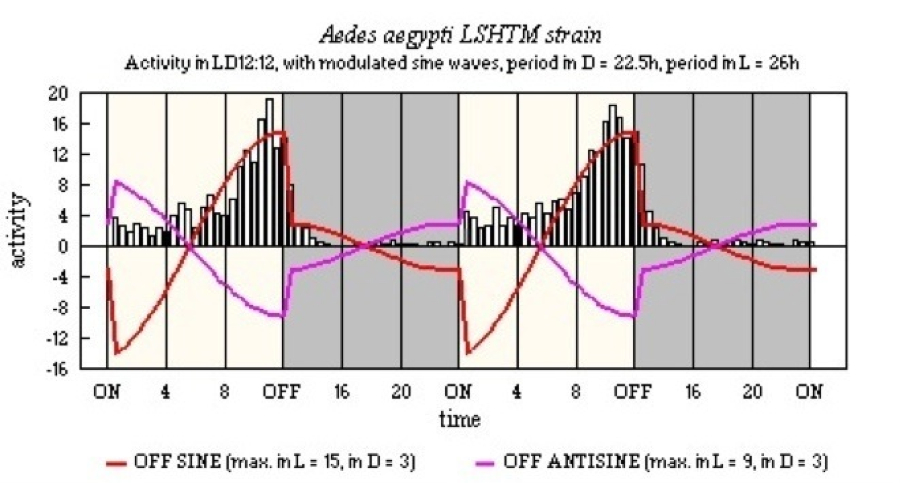
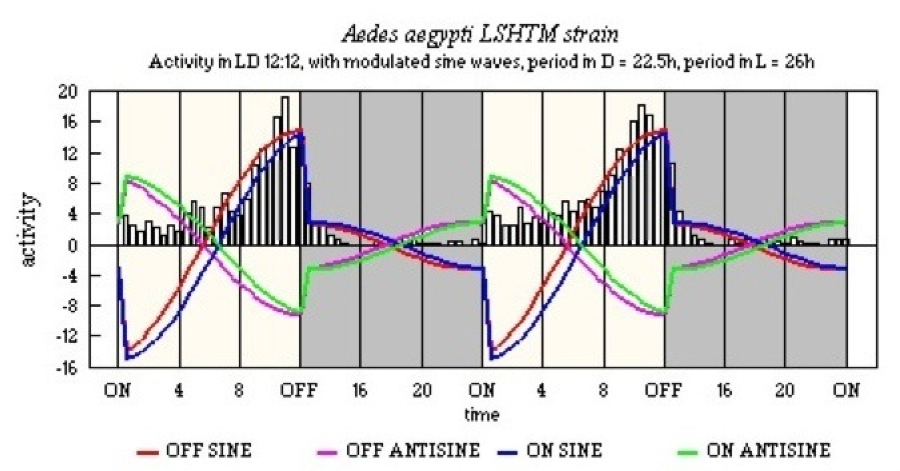
- Figure 28 Aedes aegypti, ssp. aegypti
LSHTM strain, activity in LD 12:12 with modulated OFF SINE and
OFF ANTISINE waves.
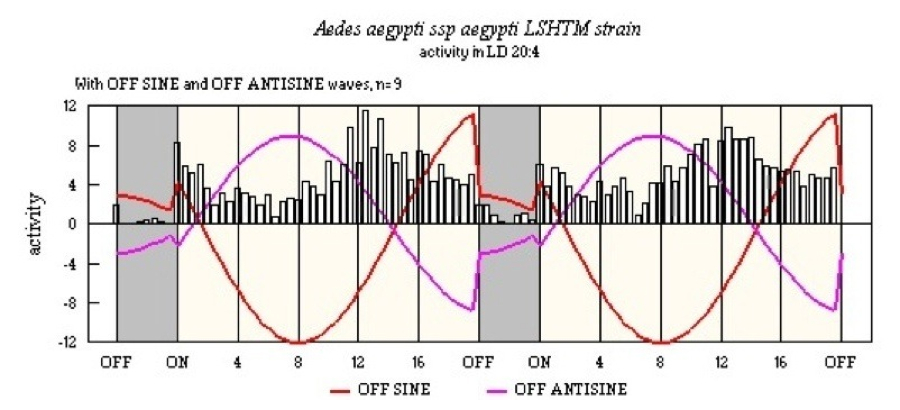
- Figure 29 Aedes aegypti, ssp. aegypti
LSHTM strain, activity in LD 20:4 with modulated OFF SINE and
OFF ANTISINE waves.
- Figure 30 Aedes aegypti, ssp. aegypti
LSHTM strain, activity in LD 20:4, with modulated OFF SINE and
OFF ANTISINE waves plus ON SINE and ON ANTISINE waves.
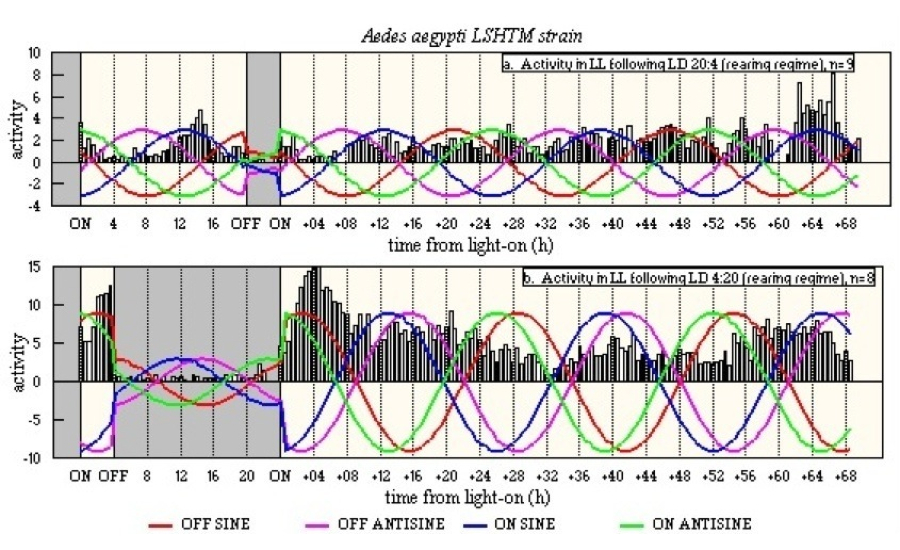
- Figure 31 Aedes aegypti, ssp. aegypti
LSHTM strain, activity in LL following (a) LD 20:4, and (b) LD
4:20 (both rearing regimes) with the full complement of OFF SINE, OFF
ANTISINE, ON SINE and ON ANTISINE waves.
- Figure 32 Aedes aegypti, ssp. aegypti
LSHTM strain, activity in LD 12:12 showing a full synthesis of
the four-clock system.
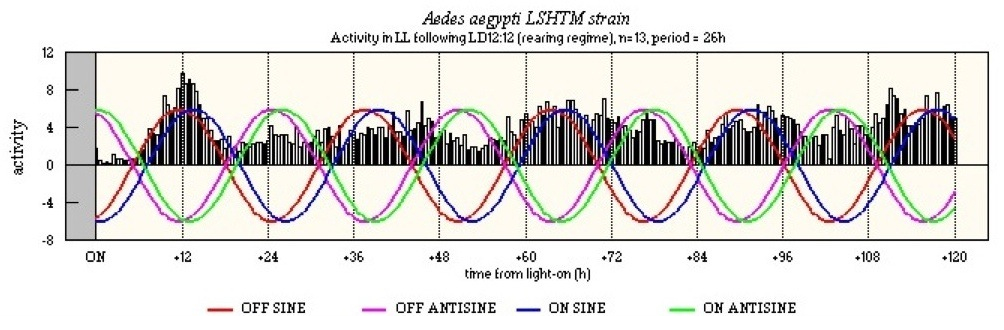
- Figure 33 Aedes aegypti, ssp. aegypti
LSHTM strain, activity in LL following rearing in LD 12:12,
showing a full synthesis of the four-clock system.
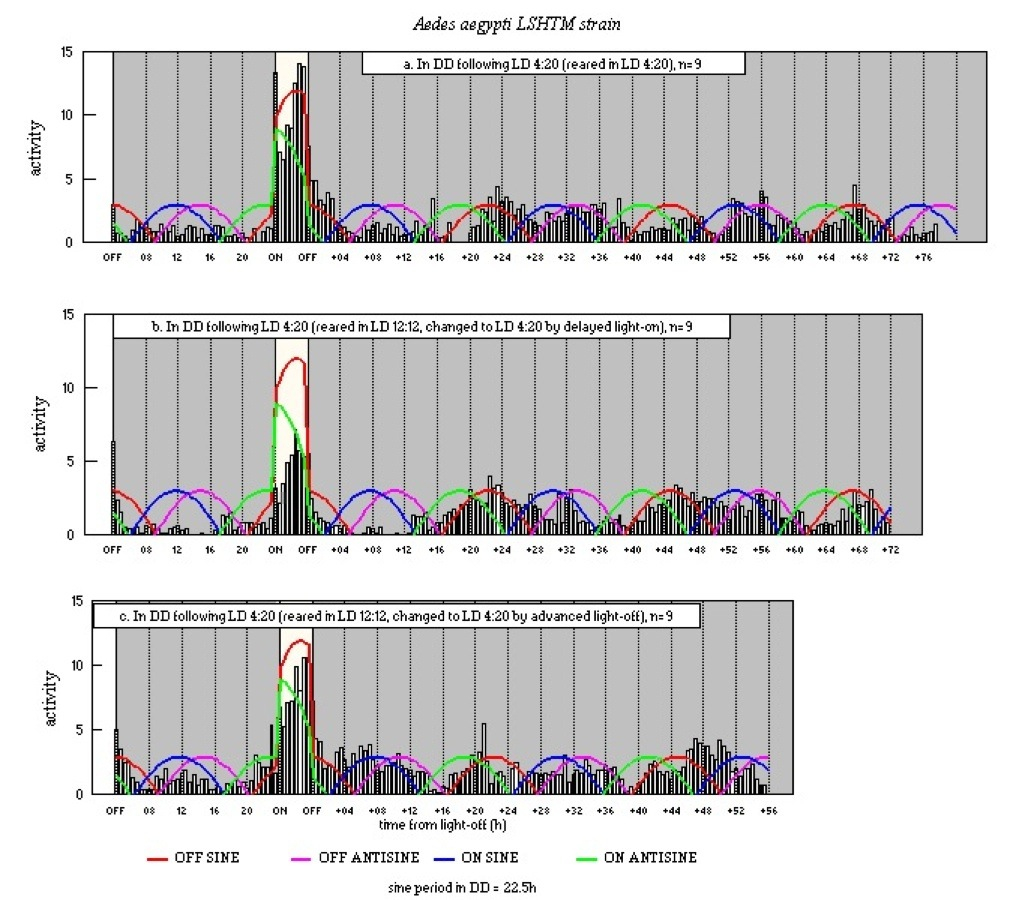
- Figure 34 Aedes aegypti, ssp. aegypti
LSHTM strain, activity in DD following (a) rearing in LD 4:20,
(b) rearing in LD 12:12, changed to LD 4:20 by delaying light-on, and
(c) rearing in LD 12:12, changed to LD 4:20 by advancing light-off;
each plus a full synthesis of the four-clock system.
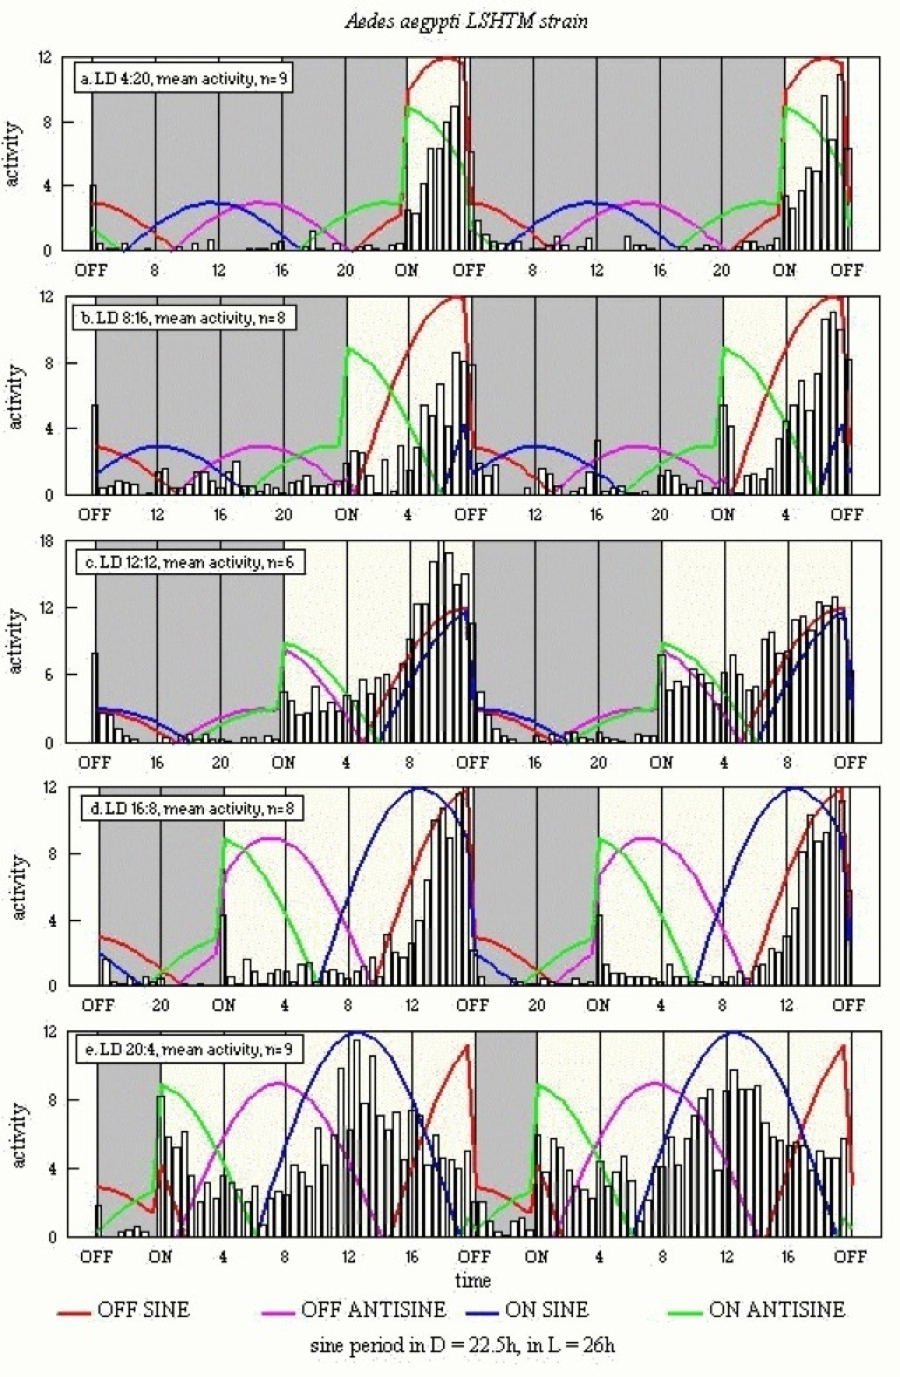
- Figure 35 Aedes aegypti, ssp. aegypti
LSHTM strain, full synthesis of four-clock system, as applied
to a range of LD regimes, for an early-crepuscular species.
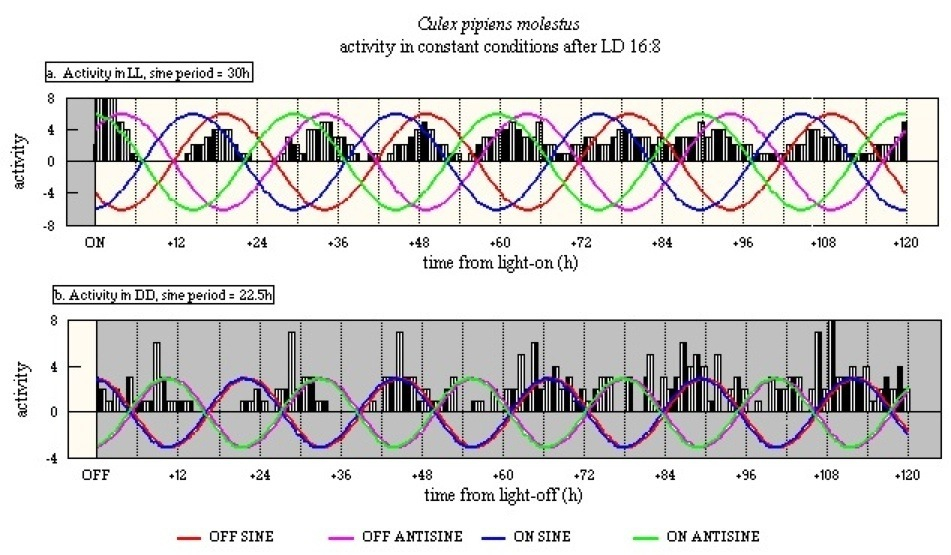
- Figure 36 Culex pipiens molestus,
circadian activity in LL and DD, plus the four-clock system. Activity
data derived from Chiba & Tomioka (1992).
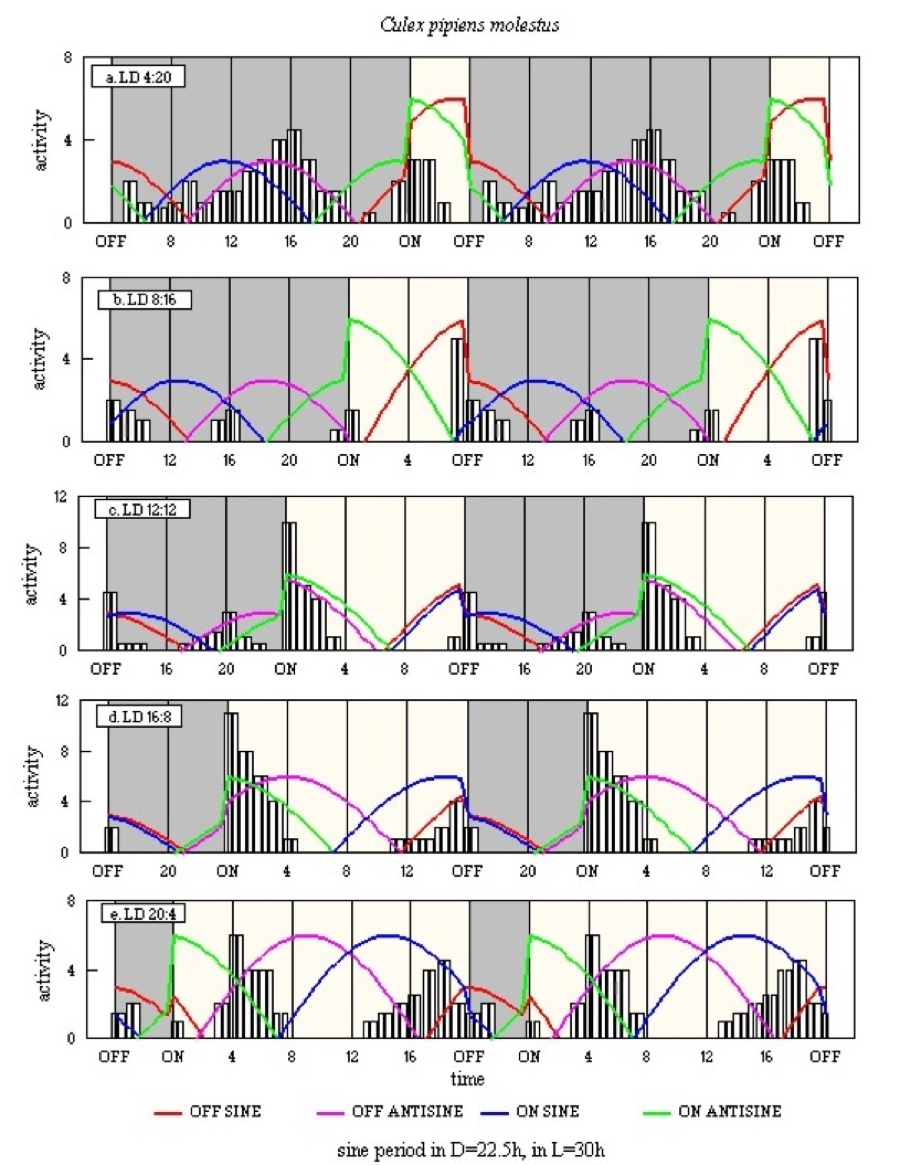
- Figure 37 Culex pipiens molestus,
full synthesis of four-clock system, as applied to a range of LD
regimes, for an early-crepuscular species. Activity data derived from
Chiba & Tomioka (1992).
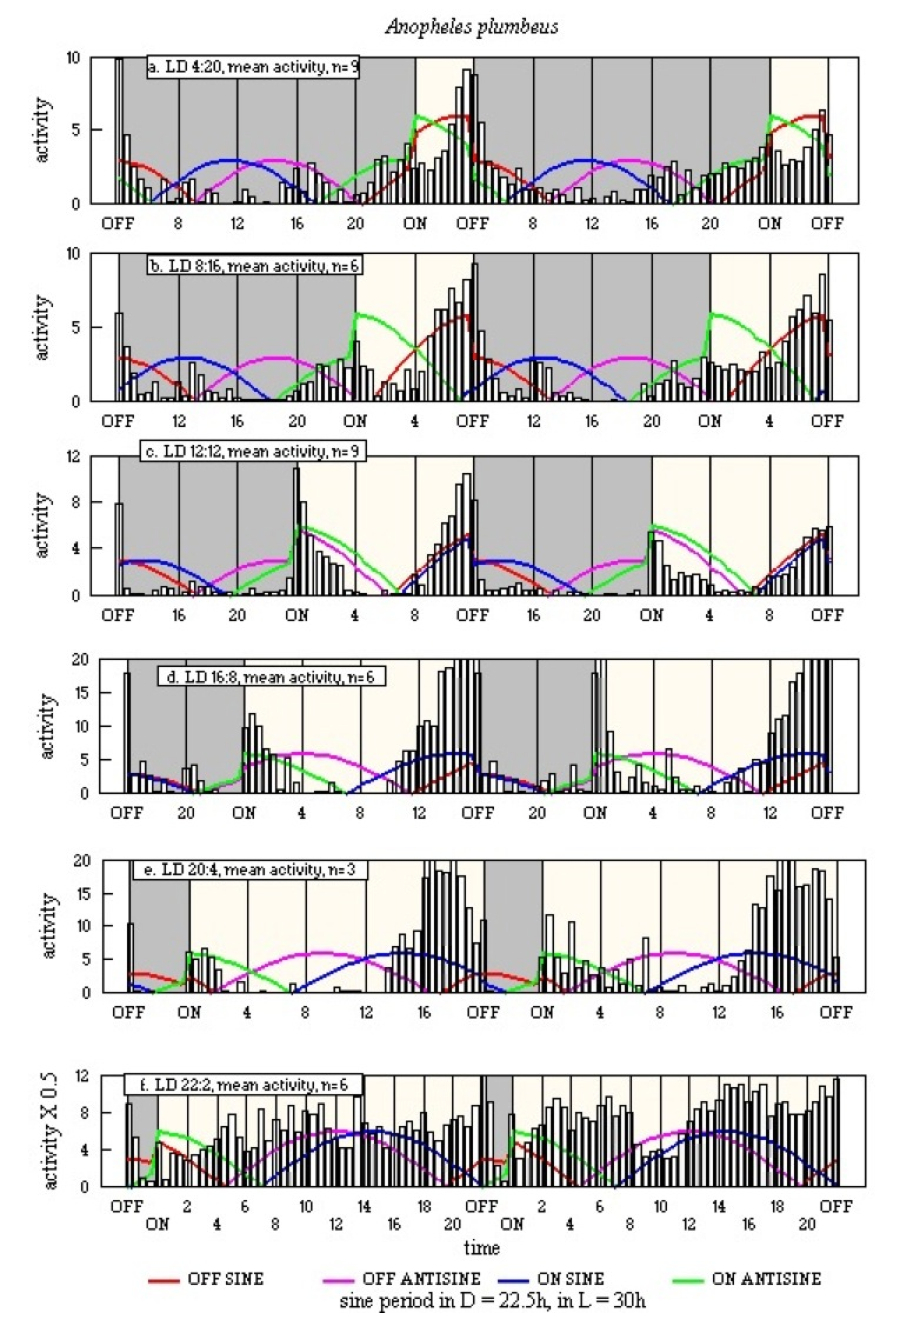
- Figure 38 Anopheles plumbeus,
full synthesis of four-clock system, as applied to a range of LD
regimes, for an early-crepuscular species.
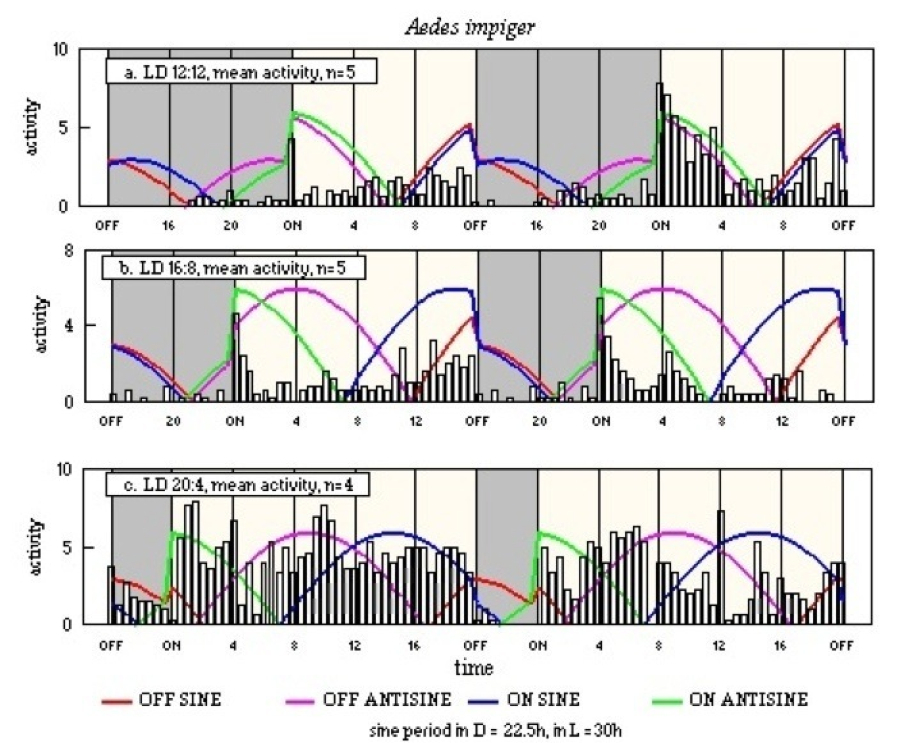
- Figure 39 Aedes impiger, full
synthesis of four-clock system, as applied to a range of LD regimes,
for a fully day-active species.
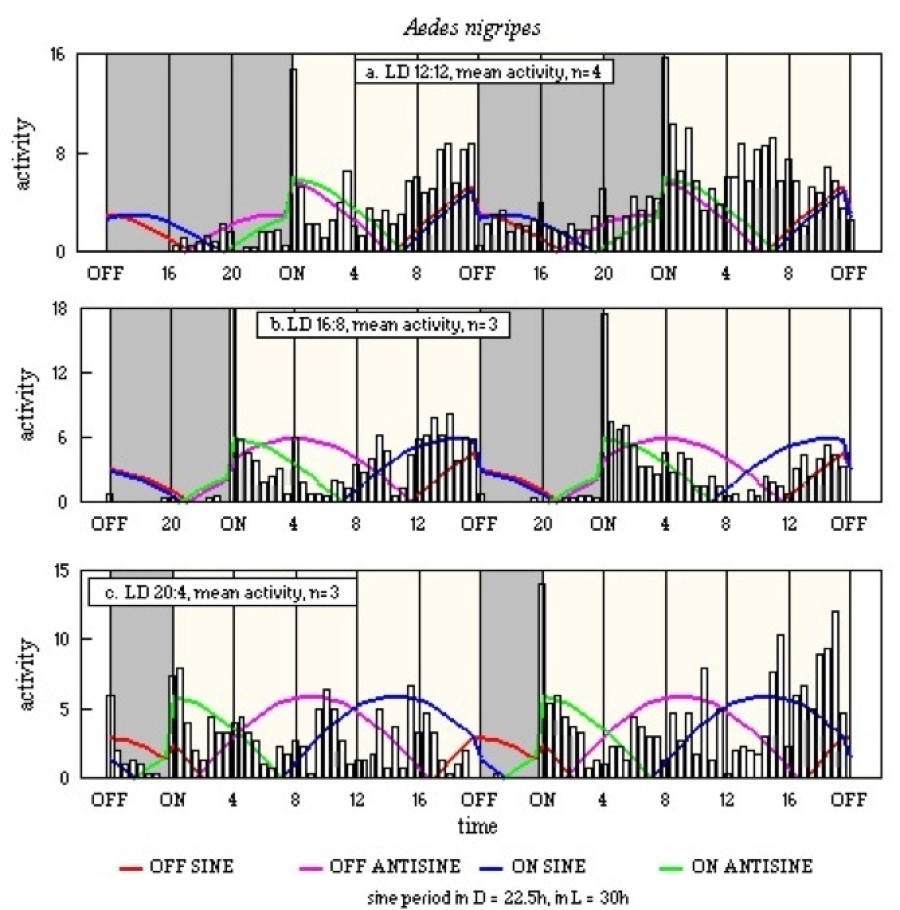
- Figure 40 Aedes nigripes, full
synthesis of four-clock system, as applied to a range of LD regimes,
for a fully day-active species.
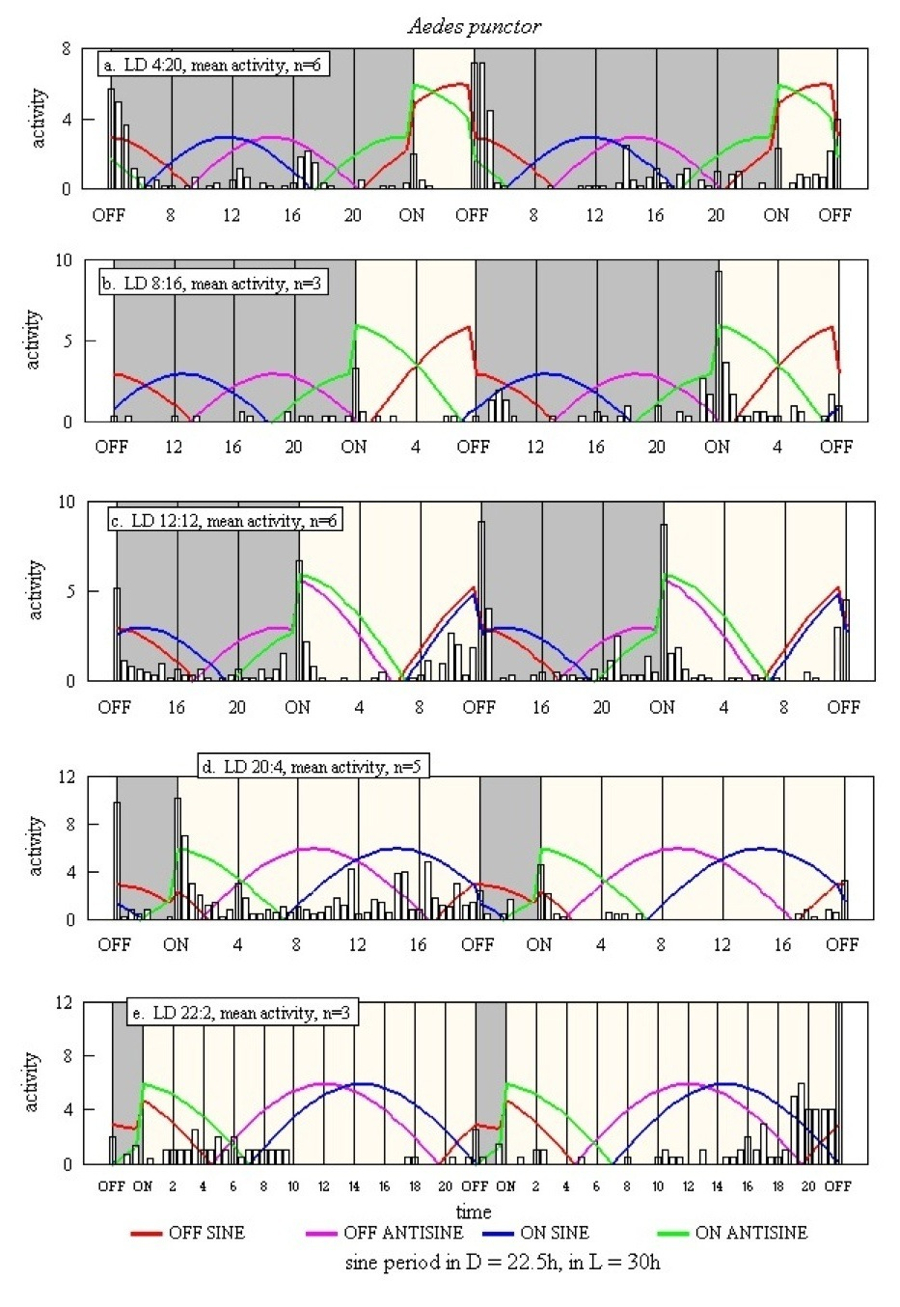
- Figure 41 Aedes punctor, full
synthesis of four-clock system, as applied to a range of LD regimes,
for a late-crepuscular species.
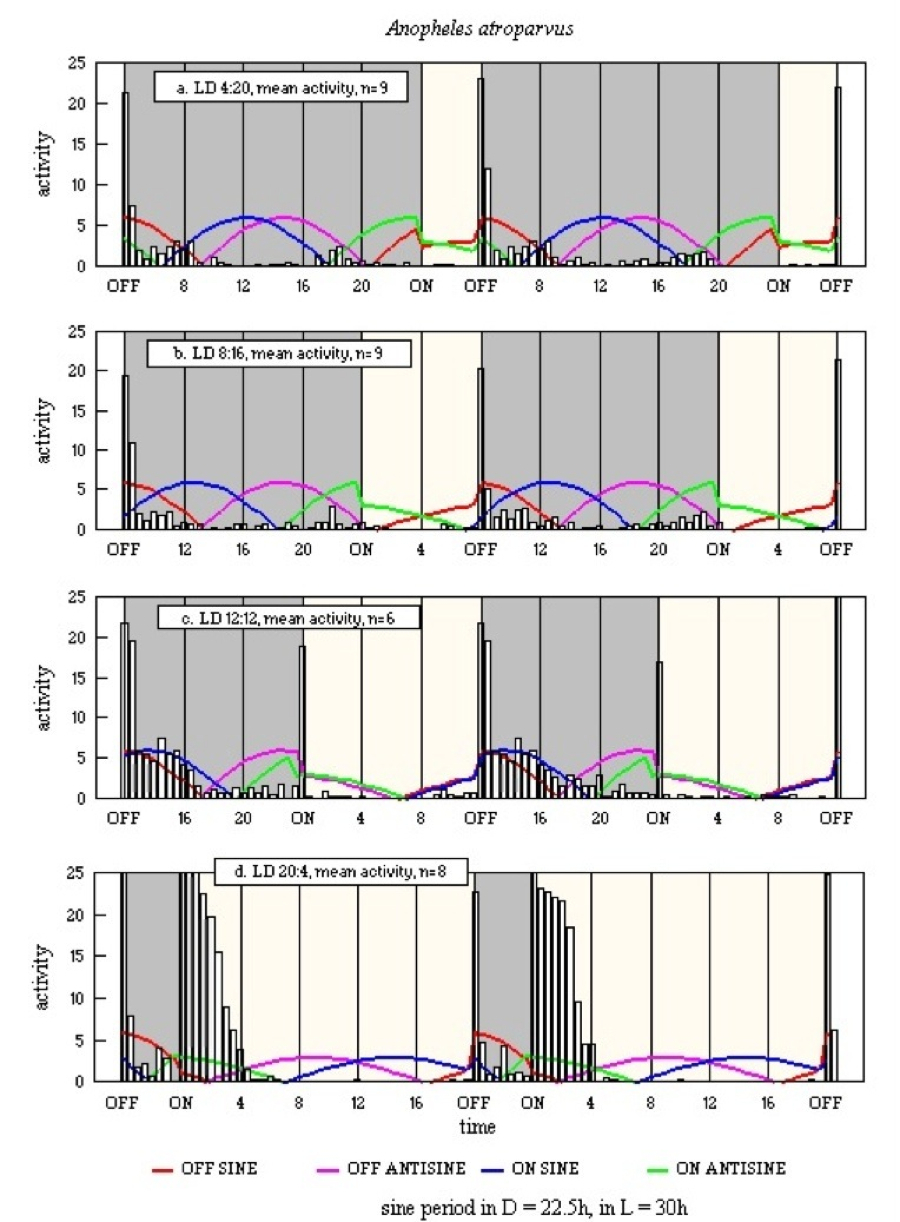
- Figure 42 Anopheles atroparvus,
full synthesis of four-clock system, as applied to a range of LD
regimes, for a late-crepuscular species.
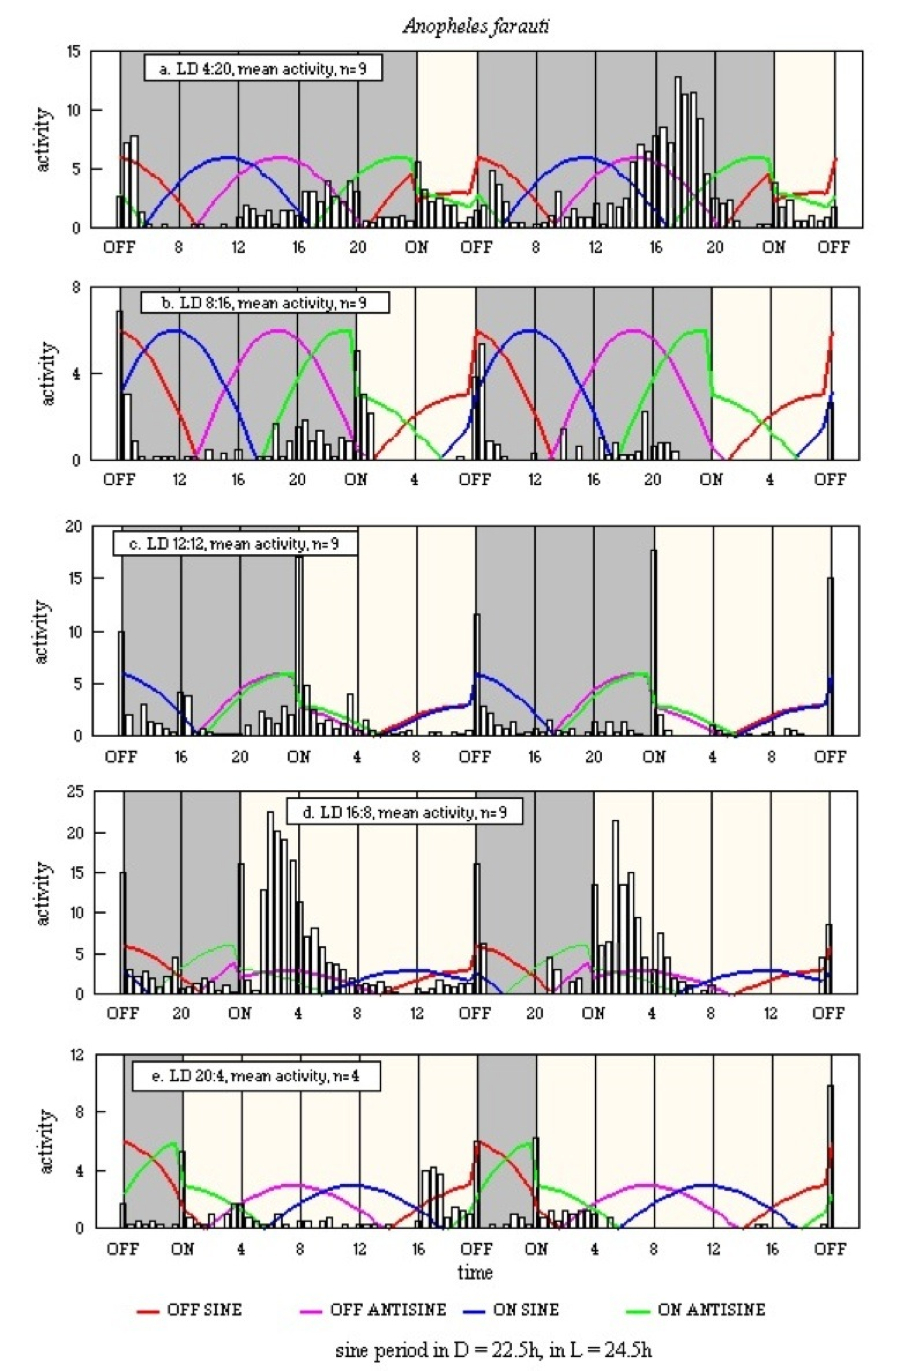
- Figure 43 Anopheles farauti,
full synthesis of four-clock system, as applied to a range of LD
regimes, for a late-crepuscular species.
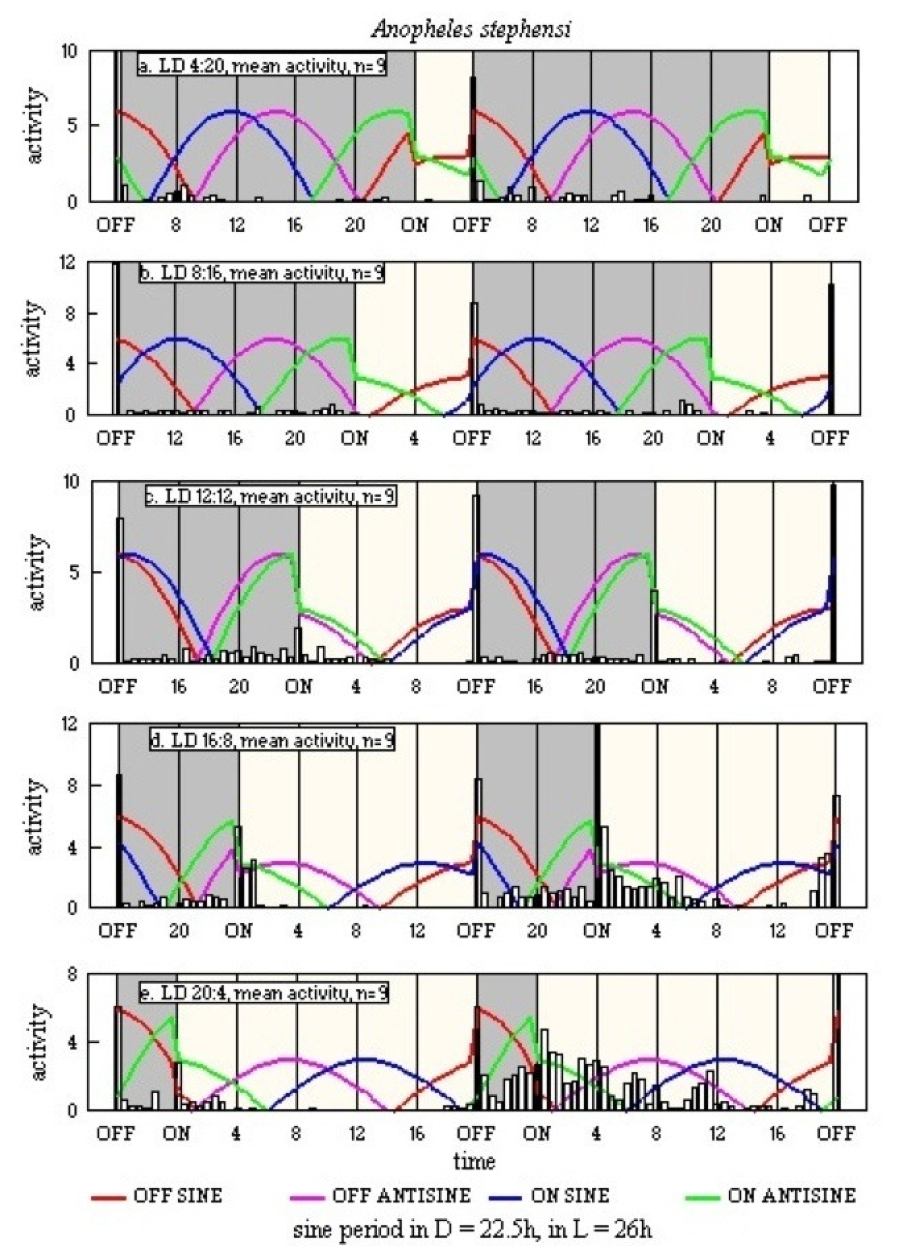
- Figure 44 Anopheles stephensi,
full synthesis of four-clock system, as applied to a range of LD
regimes, for a late-crepuscular species.
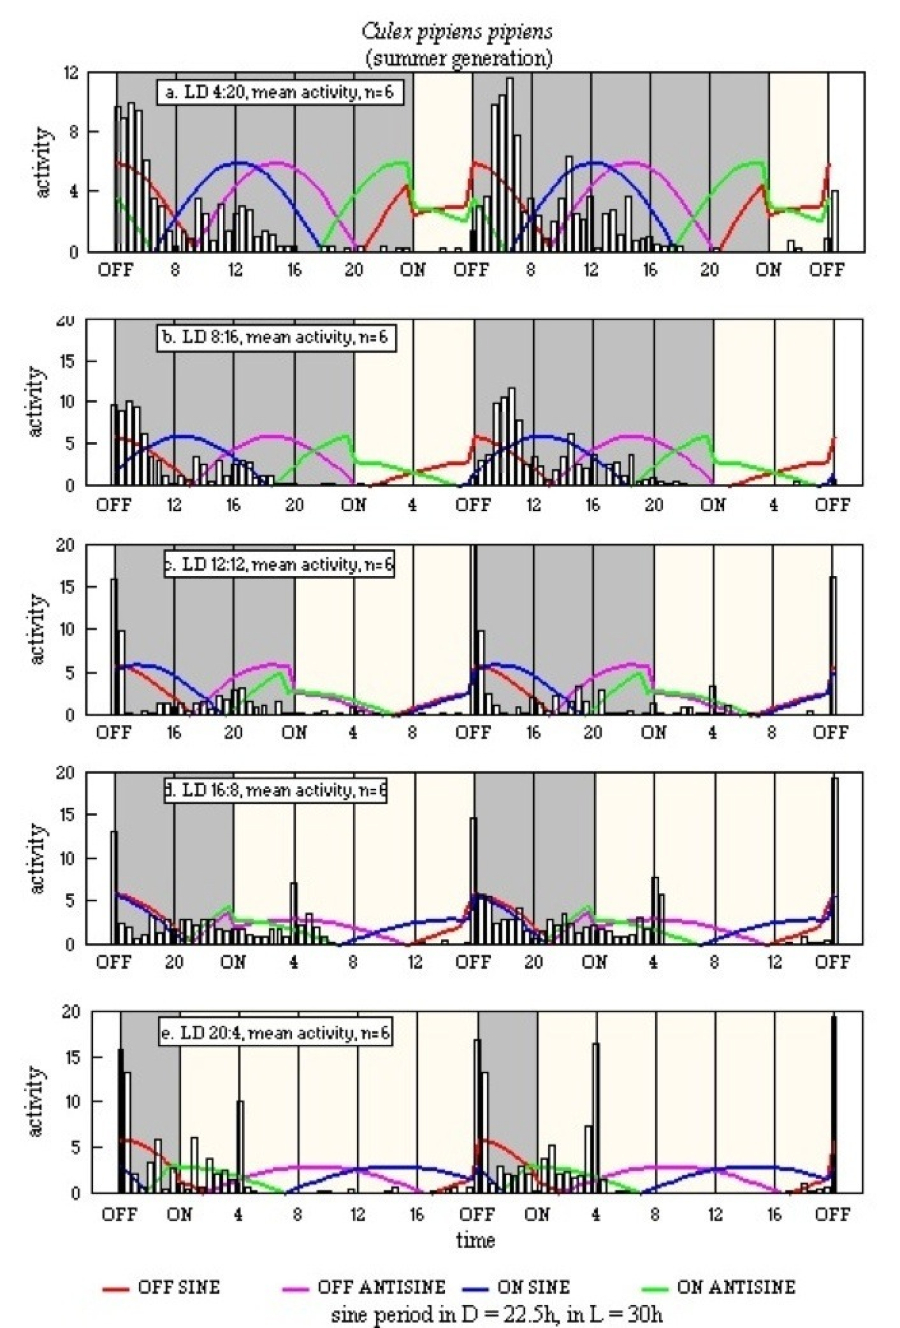
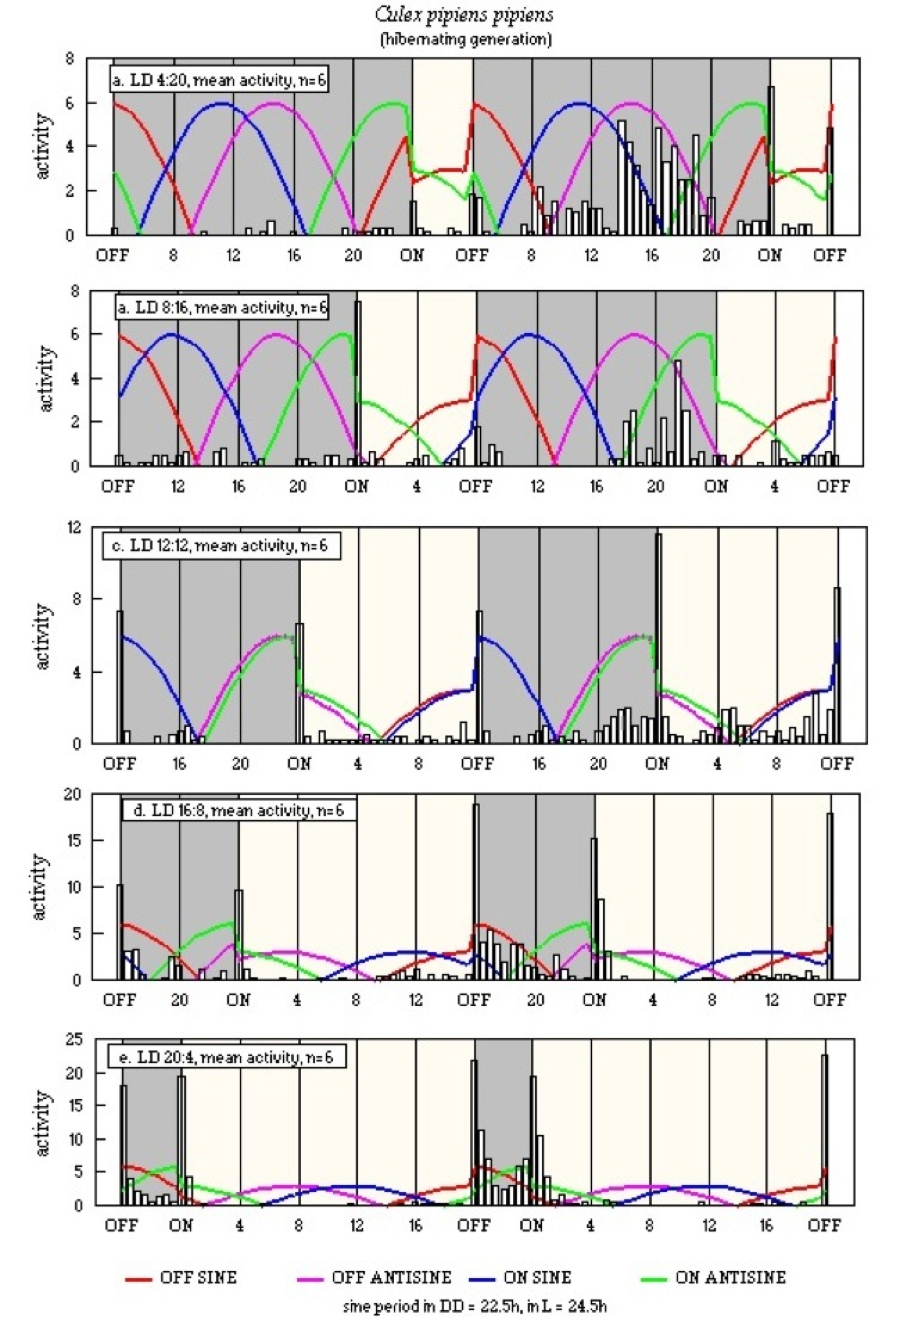
- Figure 45 Culex pipiens pipiens,
summer generation, full synthesis of four-clock system, as applied to a
range of LD regimes, for a late-crepuscular species.
- Figure 46 Culex pipiens pipiens,
winter generation, full synthesis of four-clock system, as applied to a
range of LD regimes, for a late-crepuscular species.
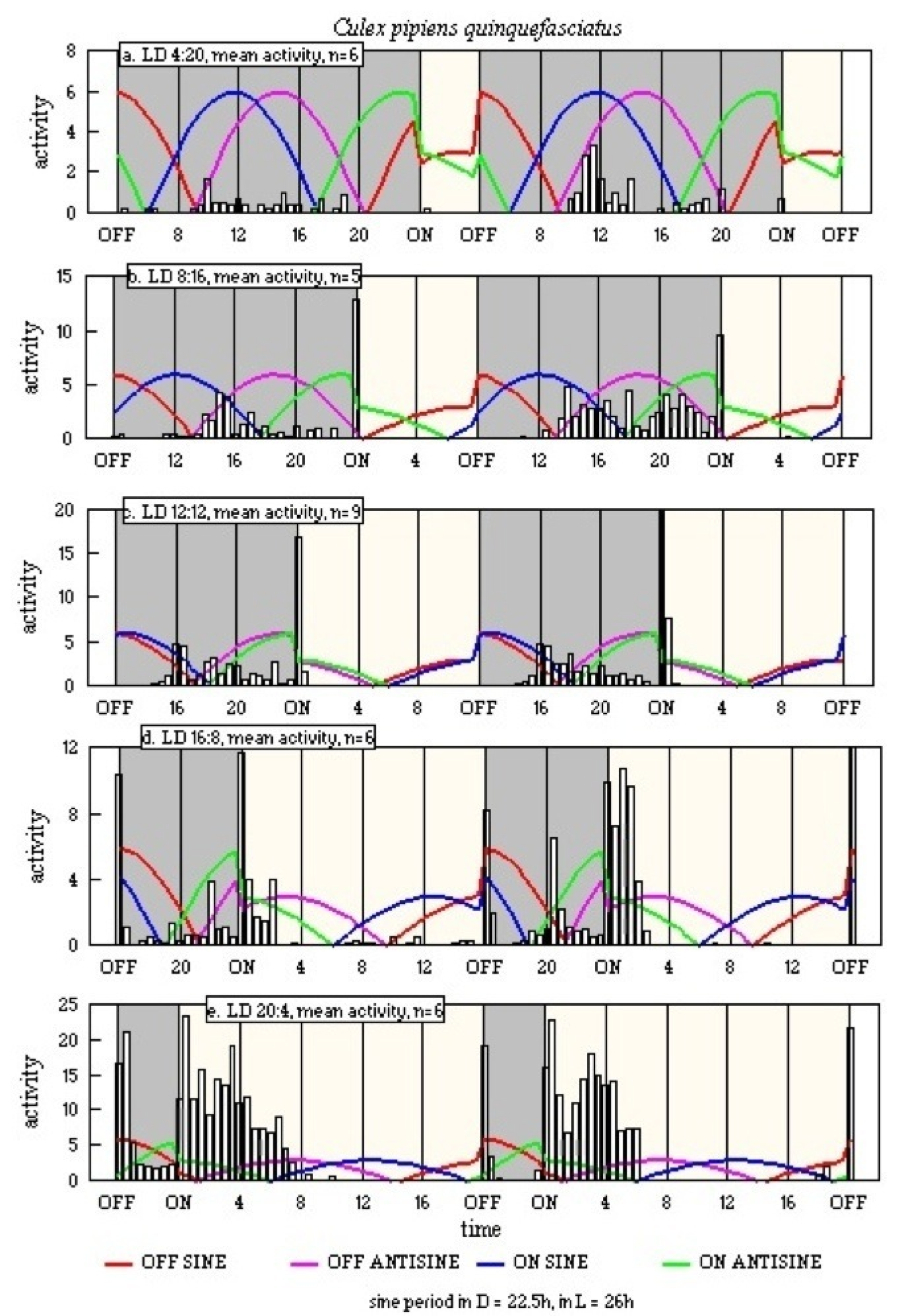
- Figure 47 Culex pipiens
quinquefasciatus, full synthesis of four-clock system, as applied
to a range of LD regimes, for a fully dark-active species.
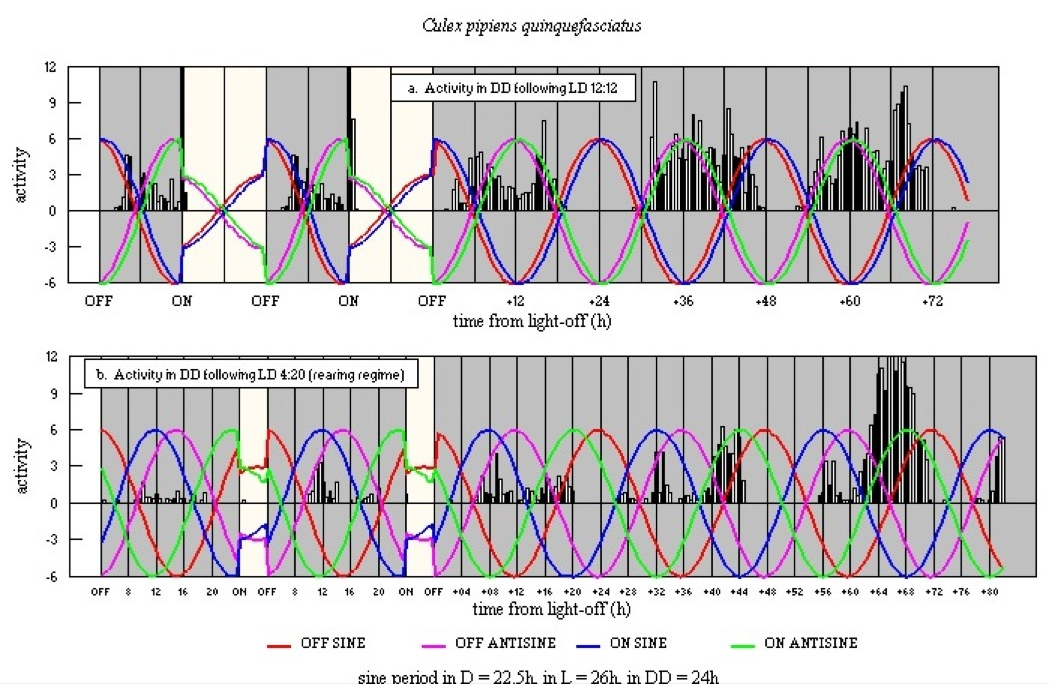
- Figure 48 Culex pipiens
quinquefasciatus, evidence for the four-clock system, for a fully
dark-active species; demonstrated by activity in DD following rearing
in (a) LD 12:12; and (b) LD 4:20.
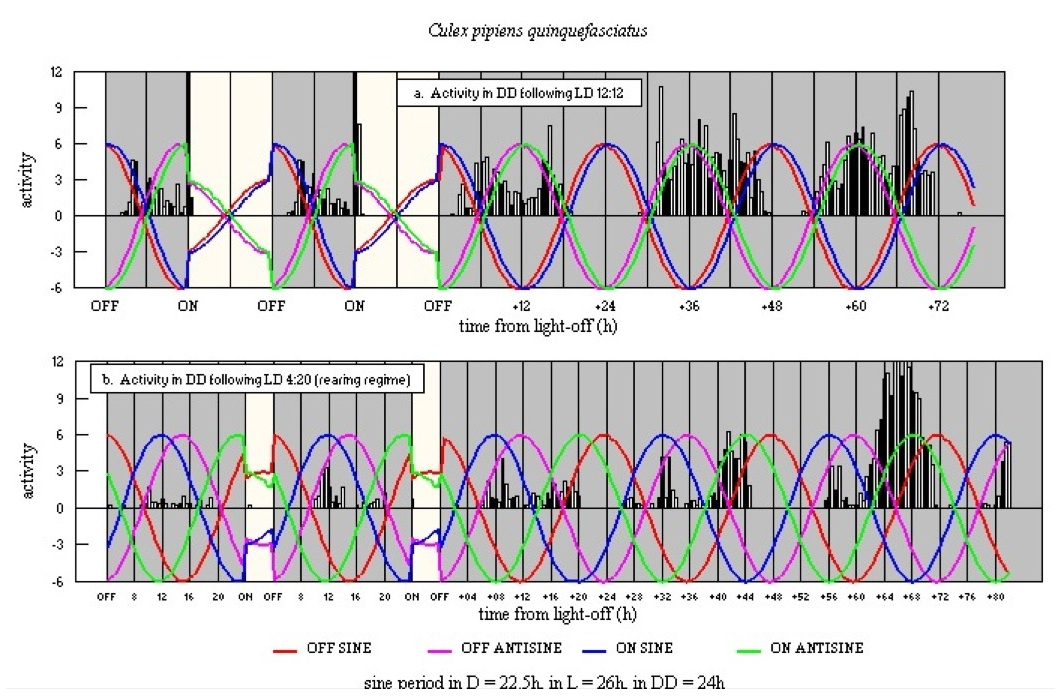
- Figure 49 Culex pipiens
quinquefasciatus,evidence for the four-clock system, for a fully
dark-active species; demonstrated by activity in DD following rearing
in (a) LD 12:12; and (b) LD 4:20; with modulation to match the observed
fully dark-active pattern.
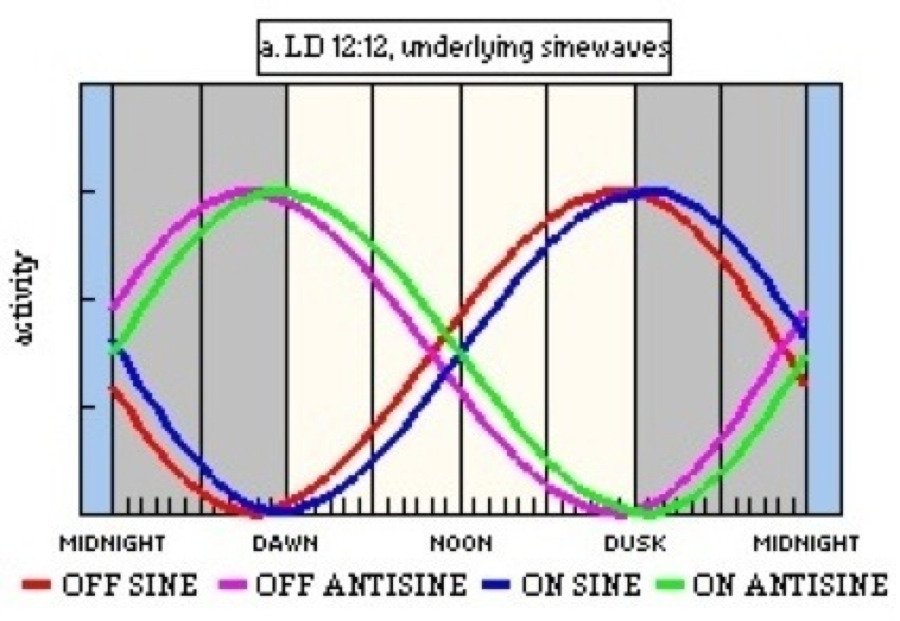
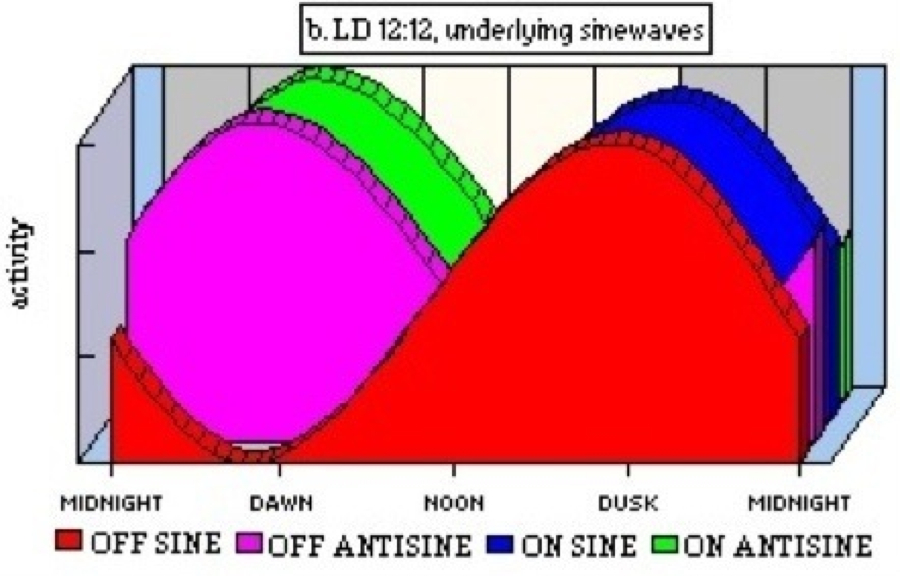
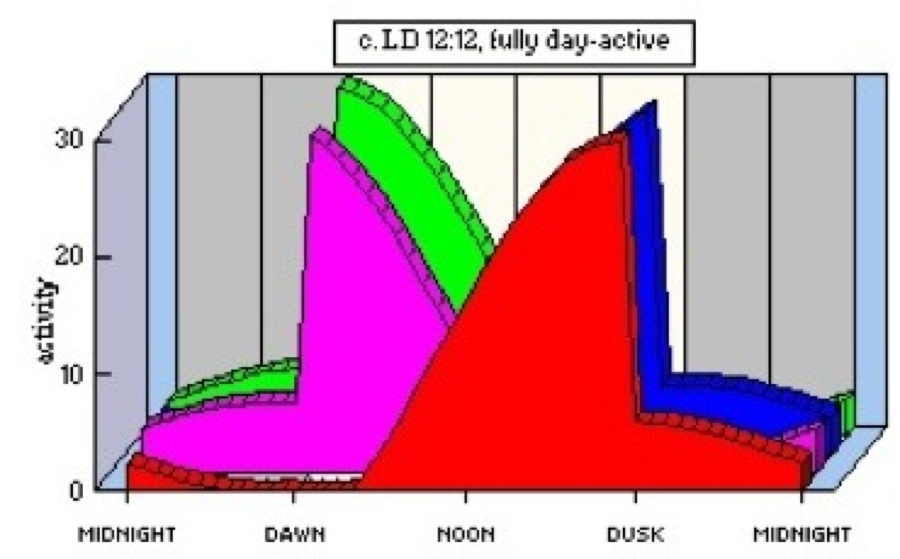
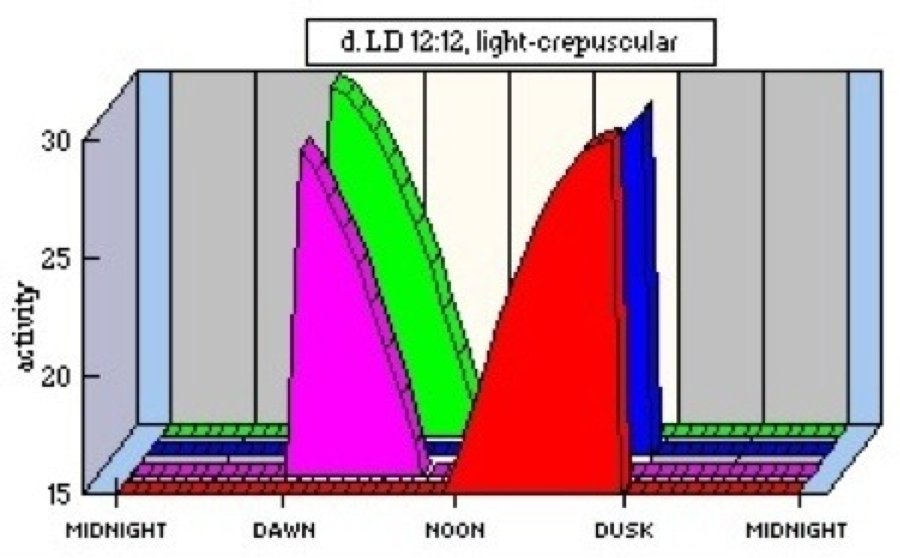
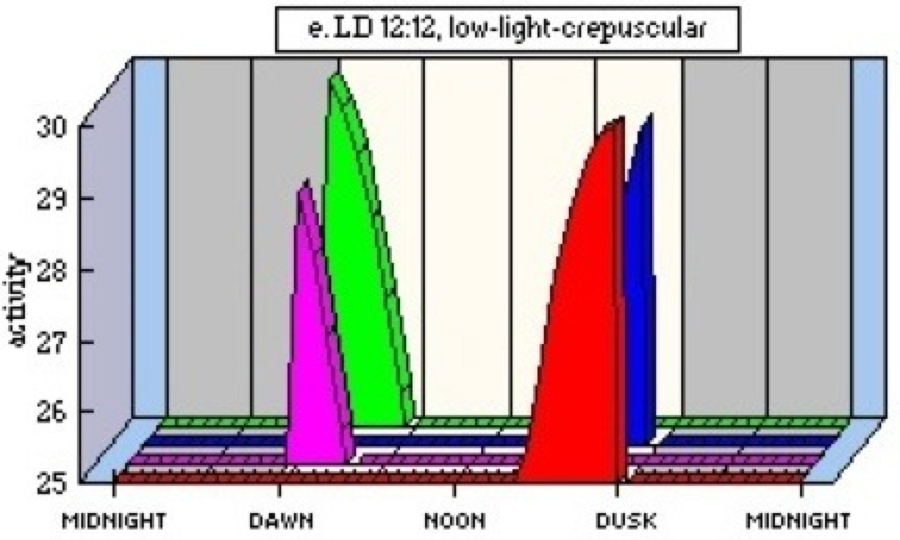
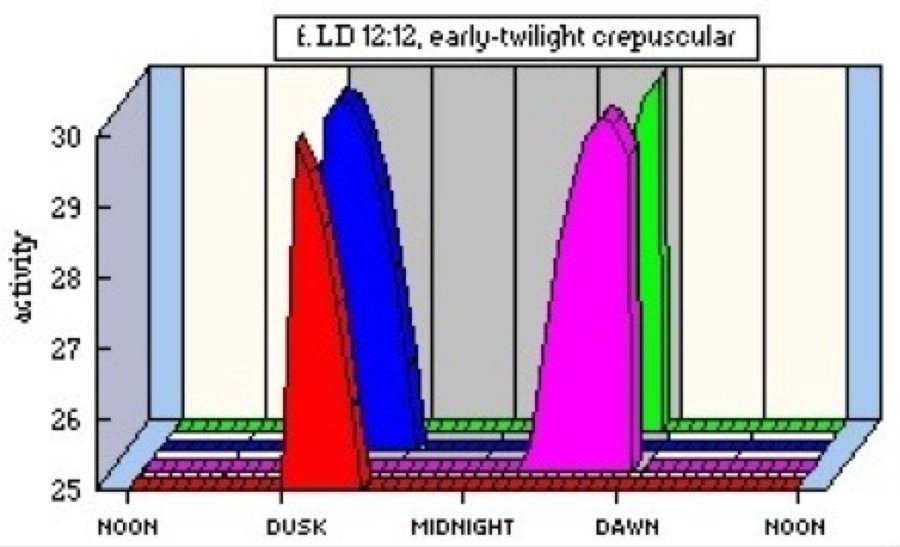
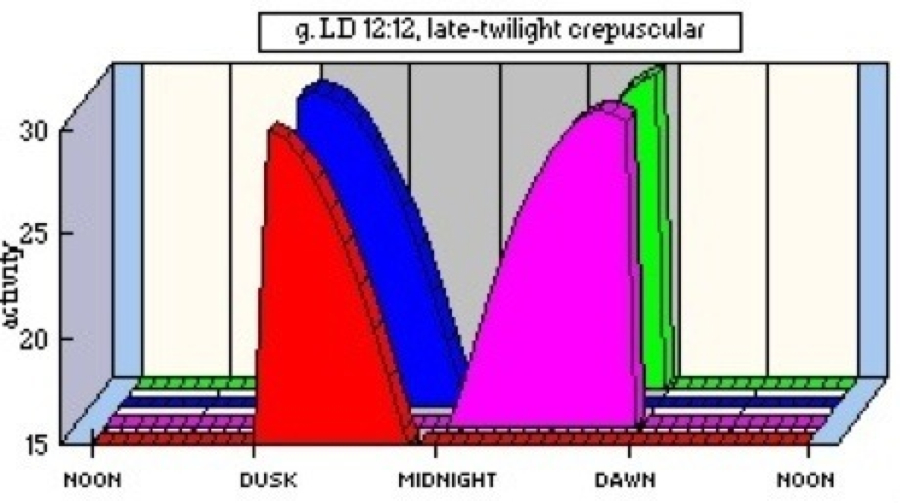
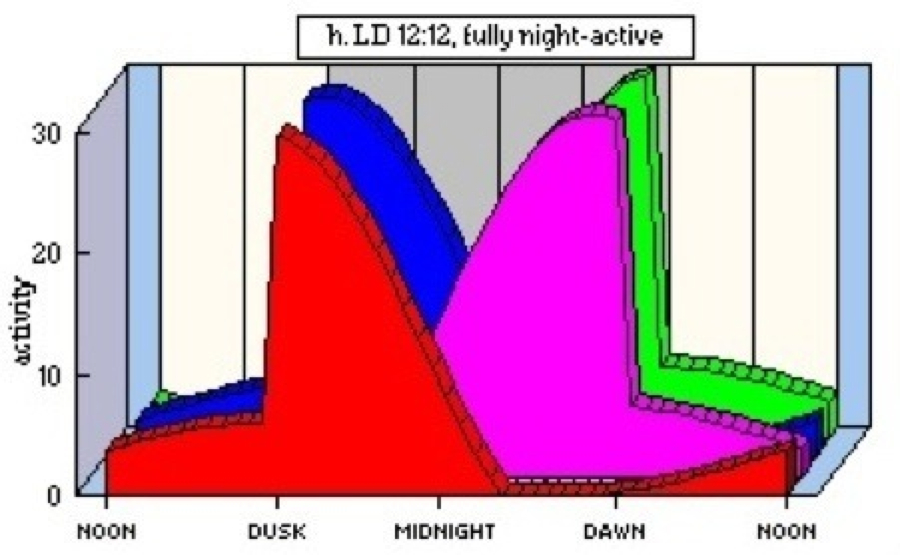
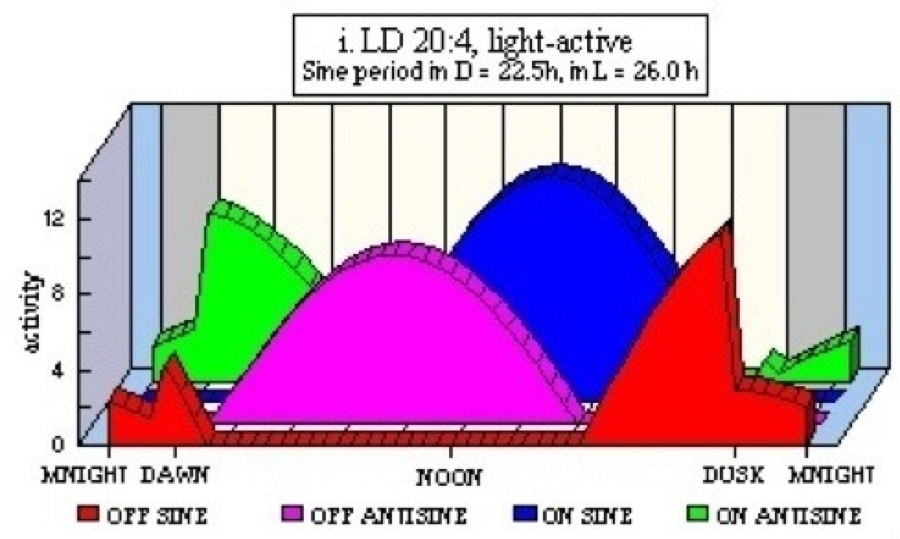
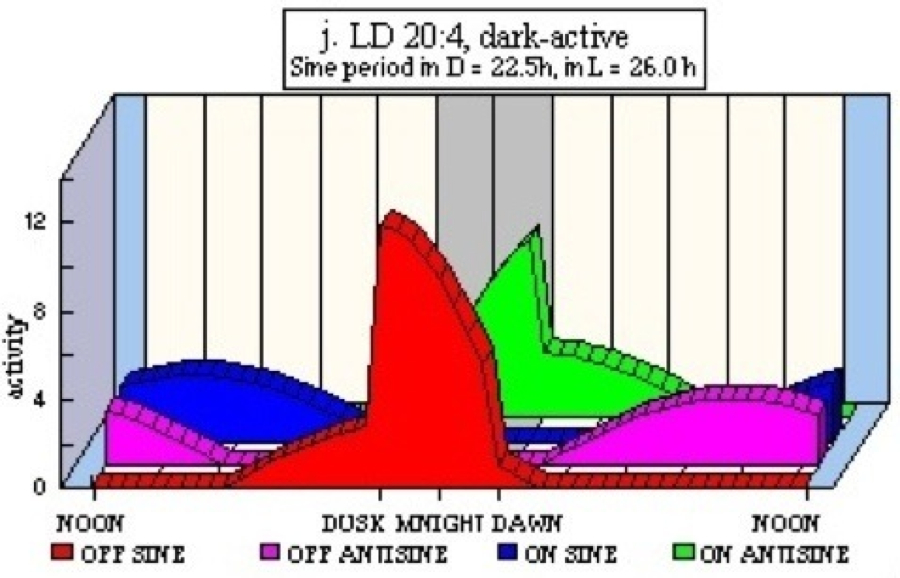
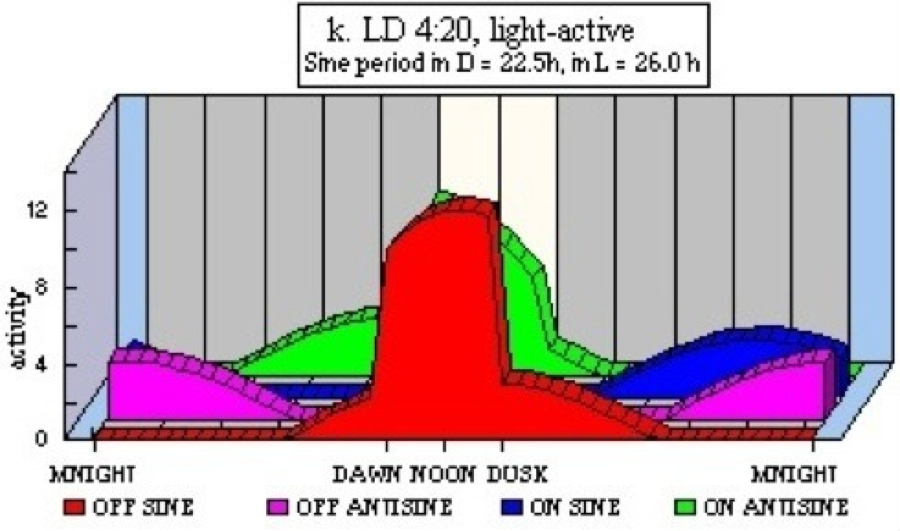
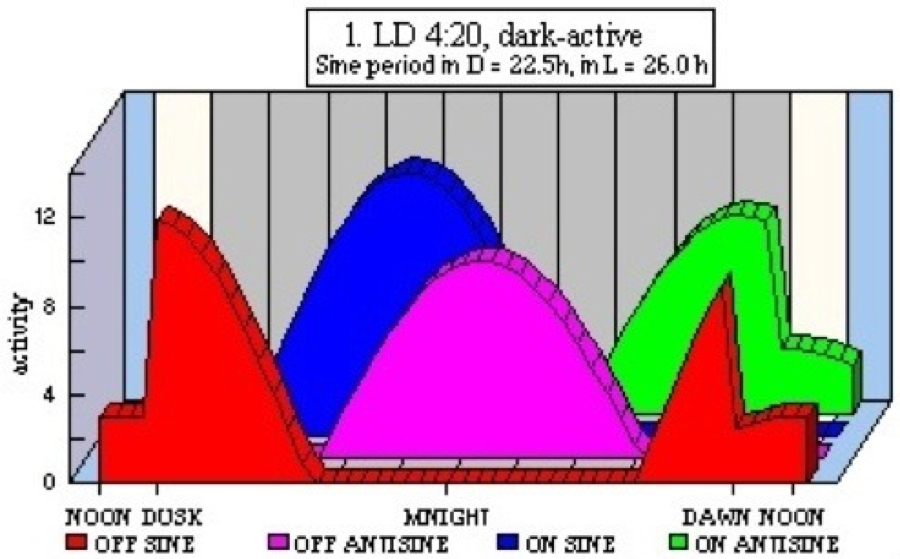
- Figure 50a, Figure
50b, Figure 50c, Figure
50d, Figure 50e, Figure
50f, Figure 50g, Figure
50h, Figure 50i, Figure
50j, Figure 50k, and Figure 50l
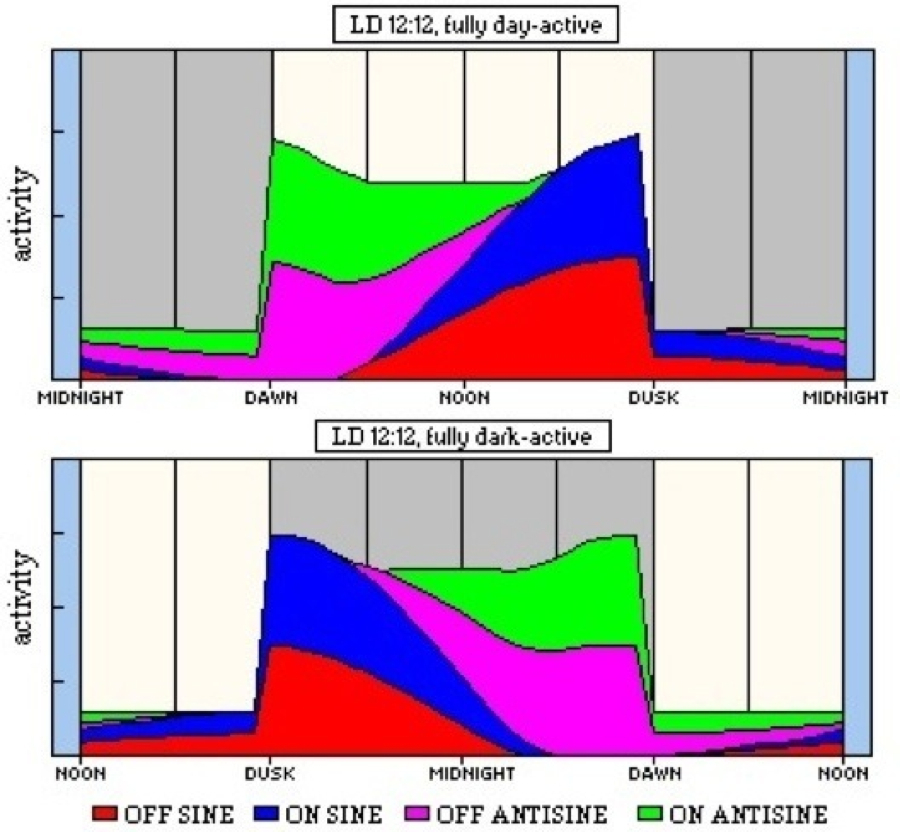
Visualization of the four-clock model of circadian activity in LD
12:12. The individual curves are plotted with a speed of 22.5h per
cycle in darkness and 26h per cycle in light. The OFF and ON waves are
reset by dusk and dawn respectively. Graphs a and b show
the full curves but the activity simulations (c-l) show only
positive values. The Y-axis indicates the potential for activity
induction - this is inhibited in dark for light-active organisms (c-e,
i and k) and in light for dark-active organisms (f-h,
j and l). The graphs for crepuscular organisms (d-g)also
simulate the effect of threshold inhibition. The separation of clocks
in extreme LD regimes is illustrated in the examples suggested for
light-active and dark-active organisms in LD 20:4 (i-j) and LD
4:20 (l-k).
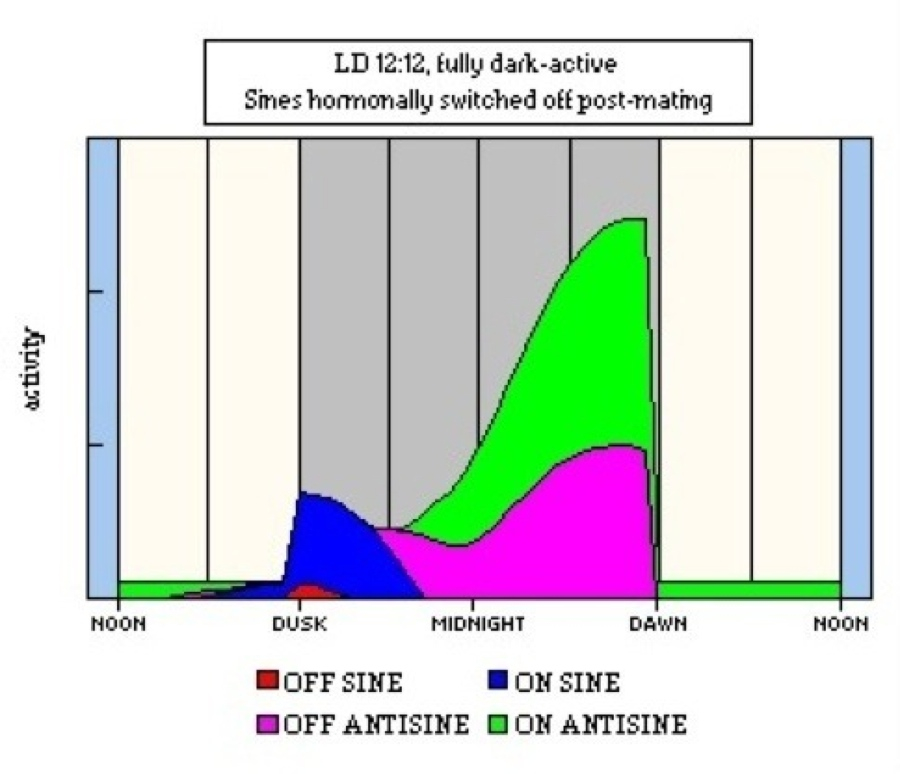
- Figure 51 The four-clock model of
circadian activity in LD 12:12 shown with the clocks having a summative
effect. Curves otherwise as in figures 50c and 50h.
- Figure 52 Visualization of the effect
of hormonal suppression of the SINE clocks in inseminated females of
certain mosquito species.
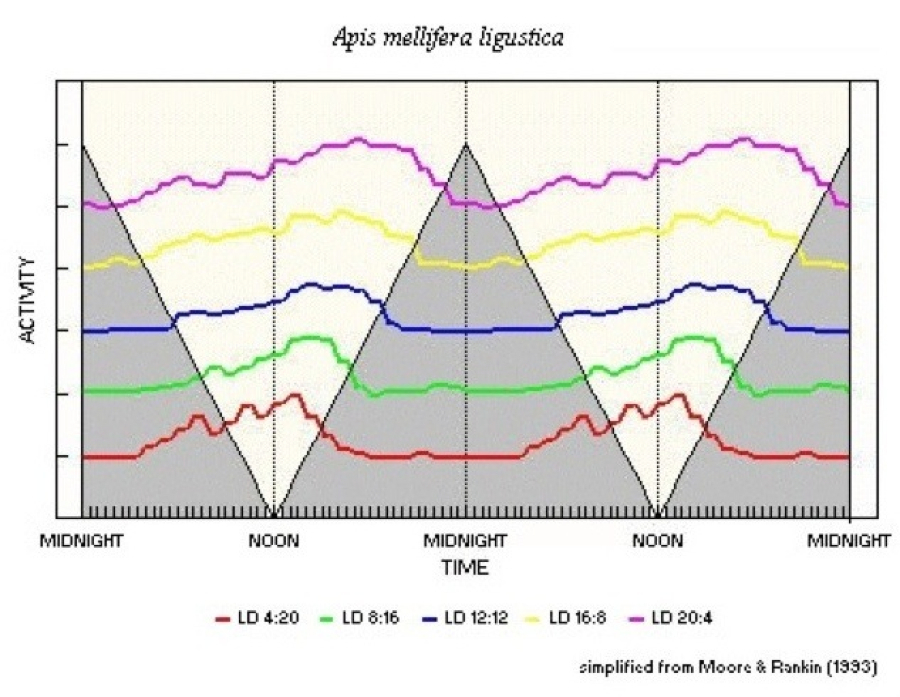
- Figure 53 Photoperiodogram of the
walking rhythm of honeybees, Apis mellifera ligustica, derived
from Moore & Rankin (1993).
Appendix Figures
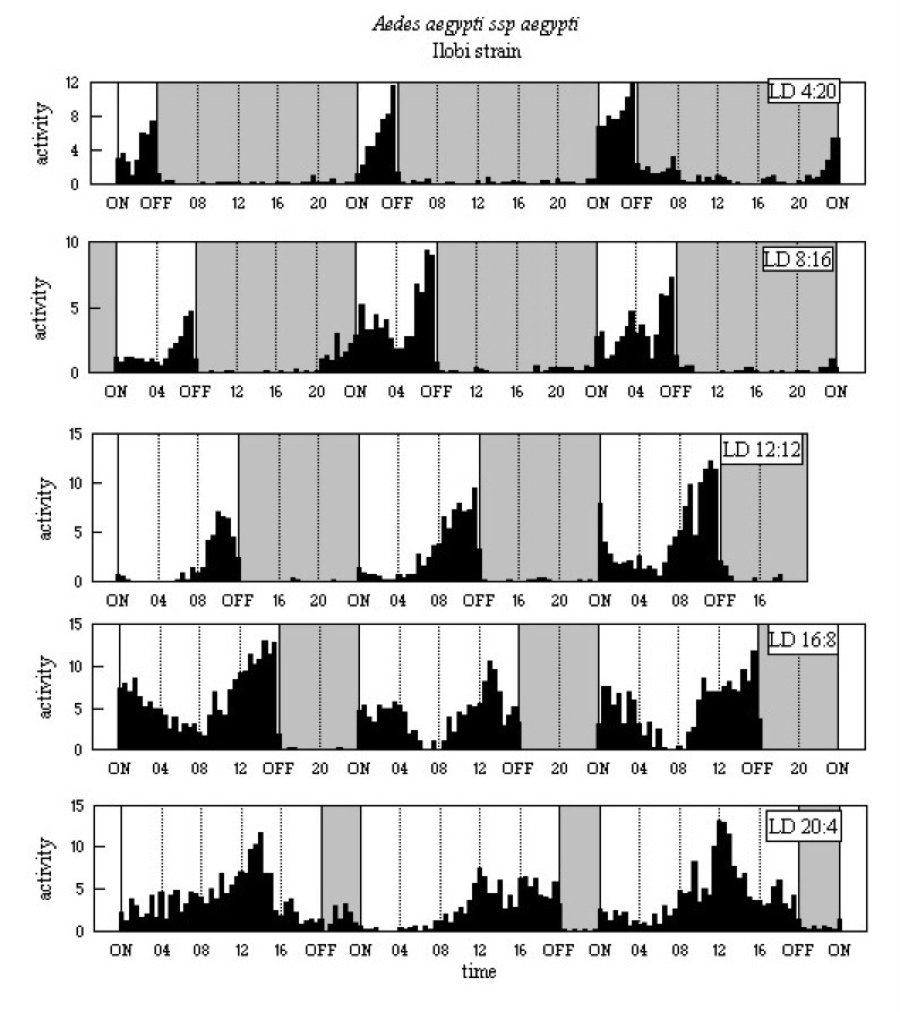
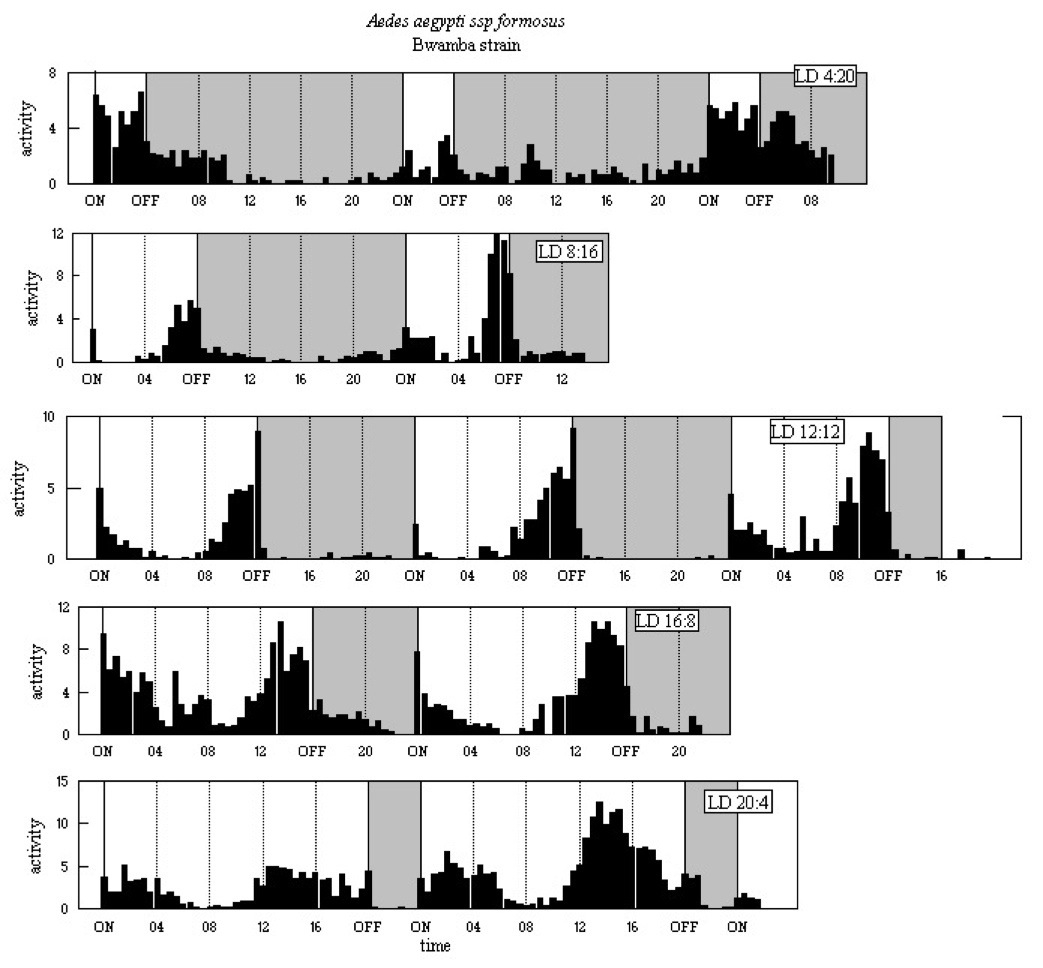
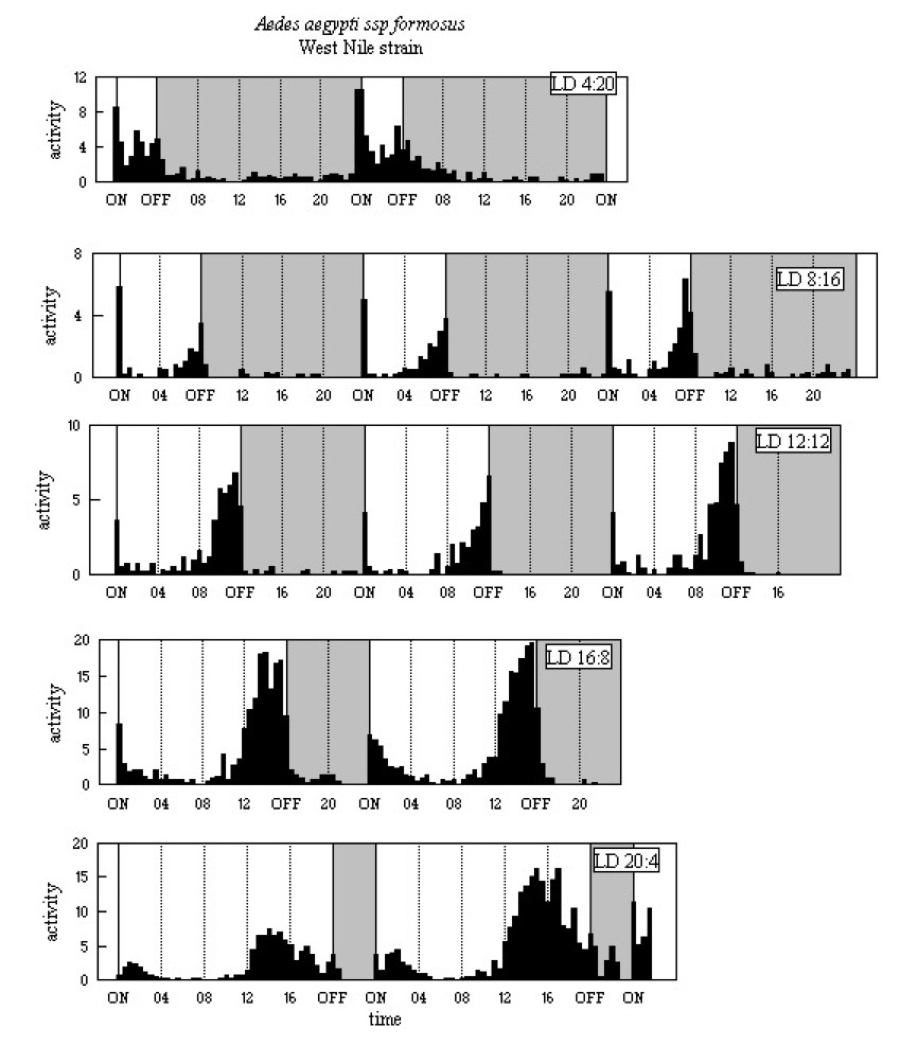
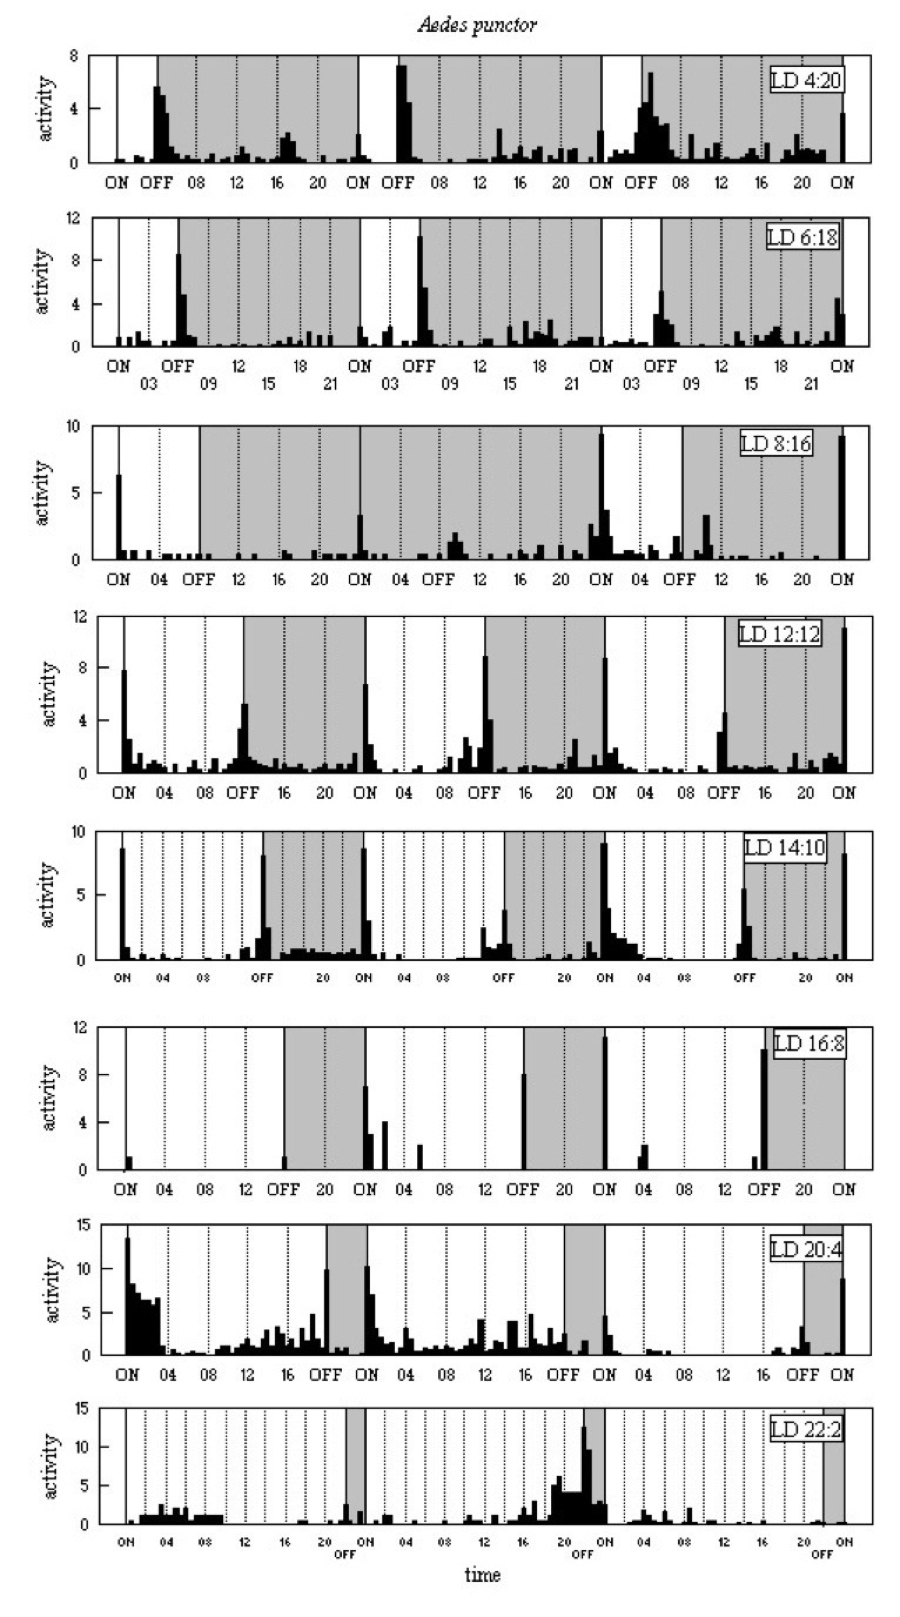
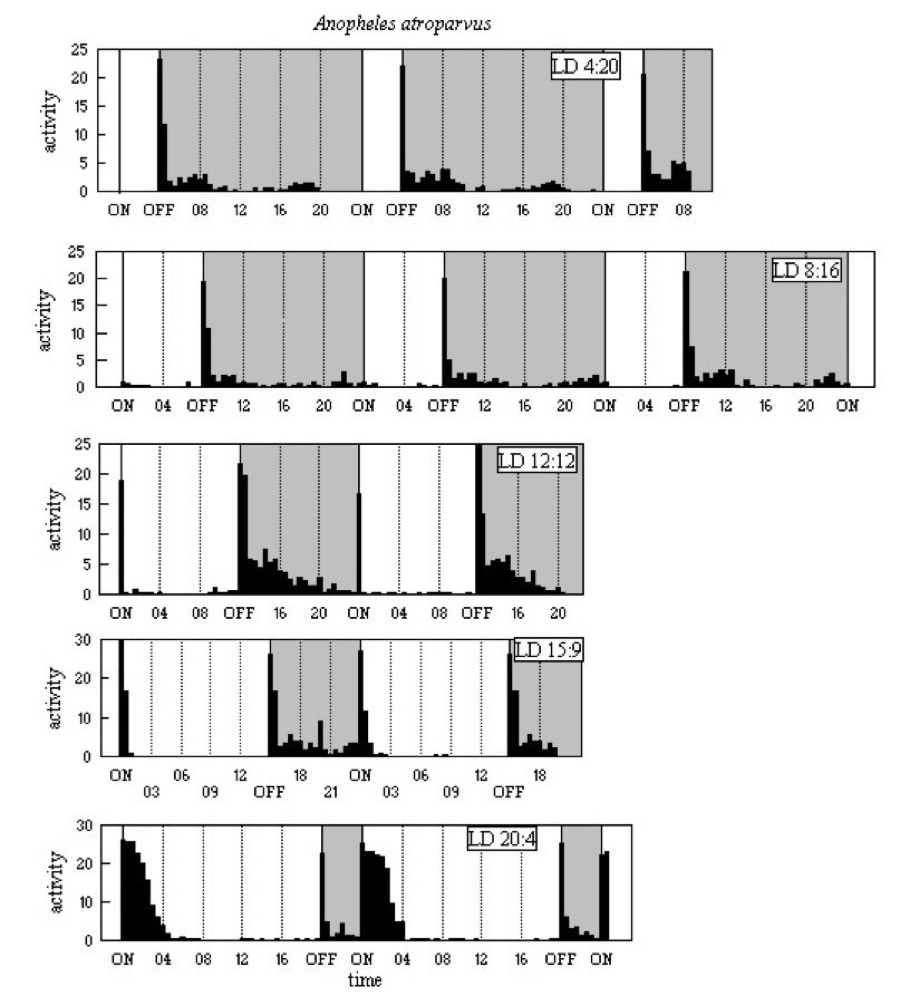
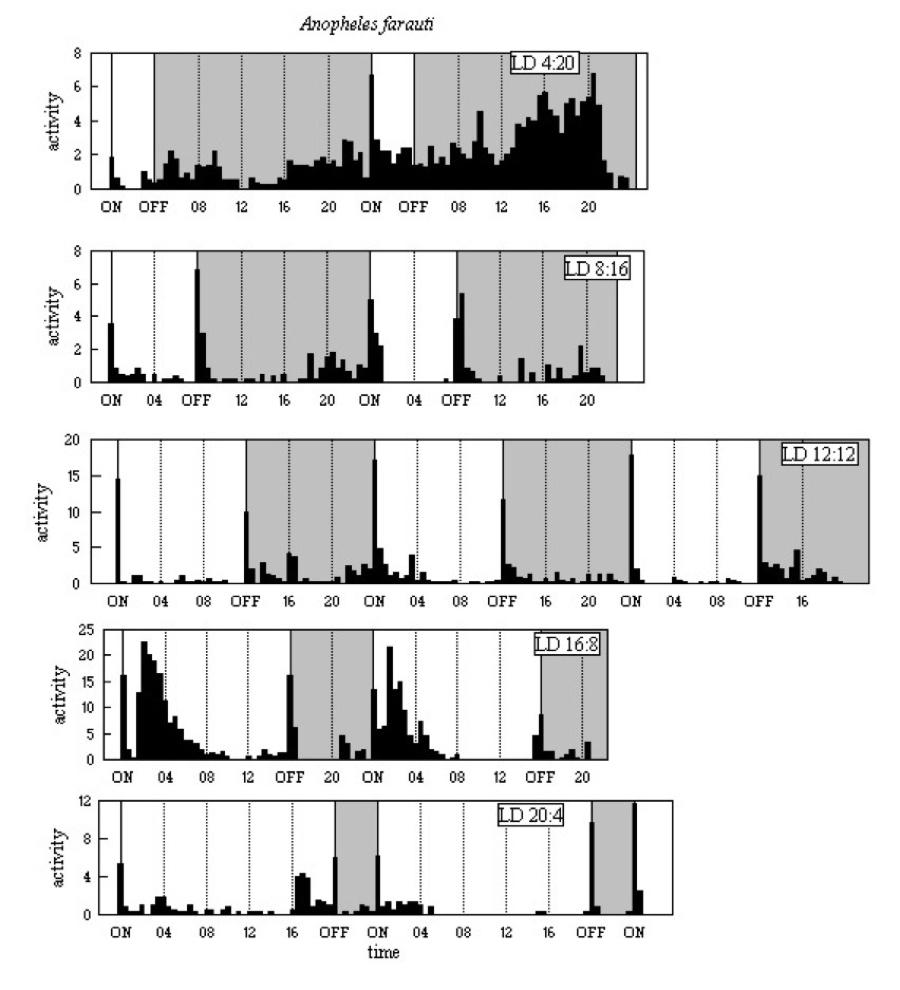
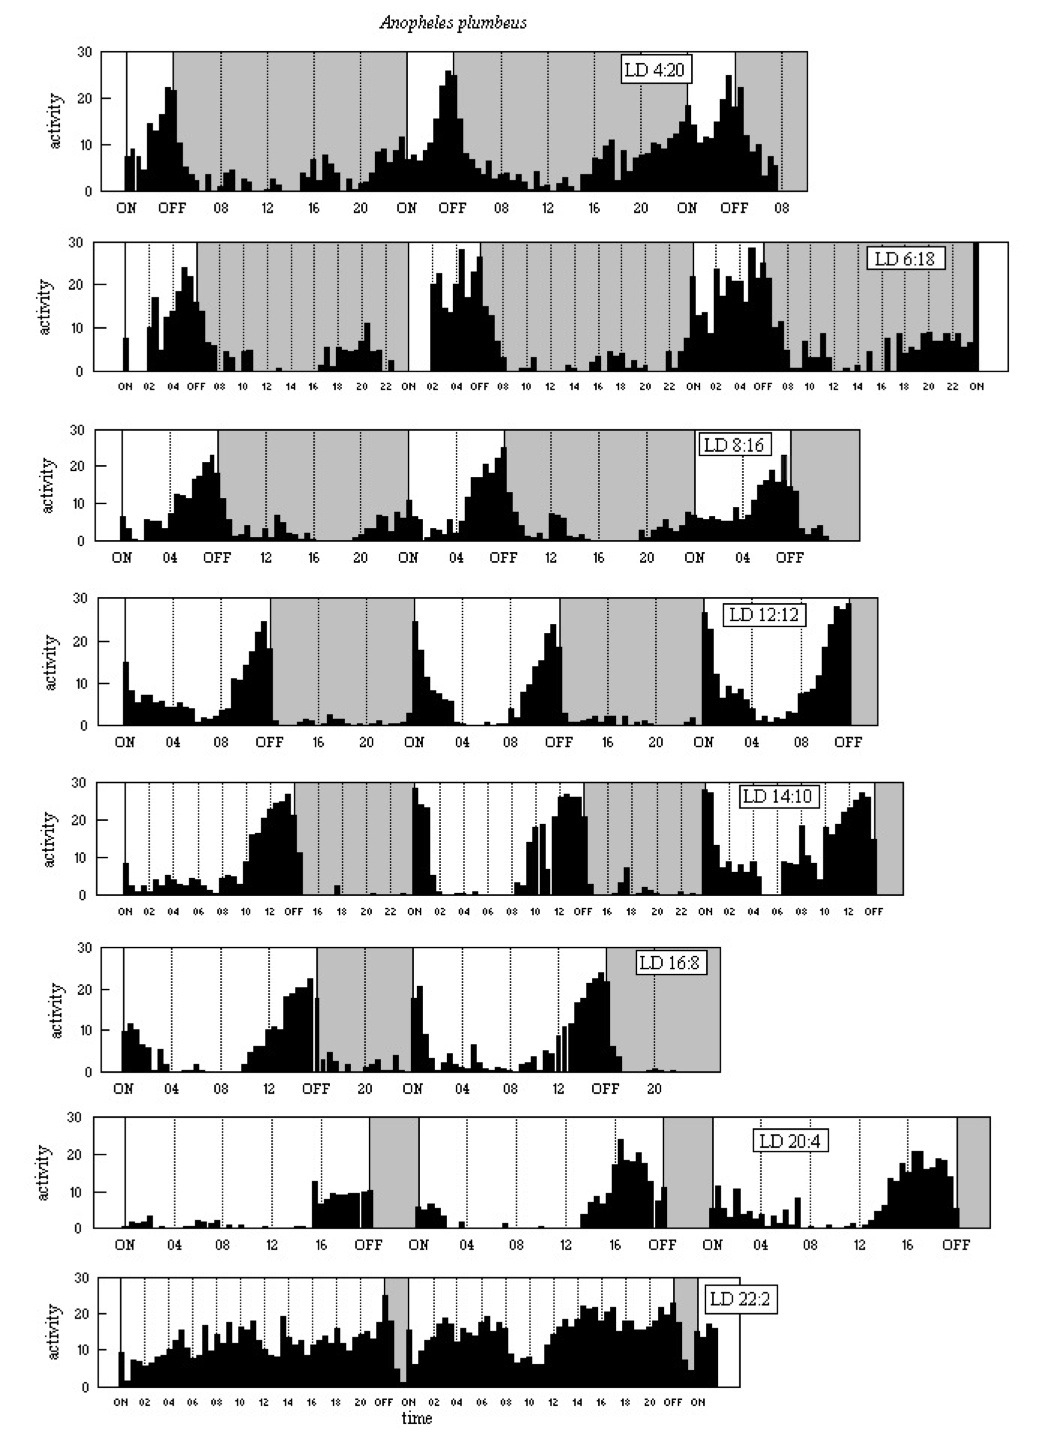
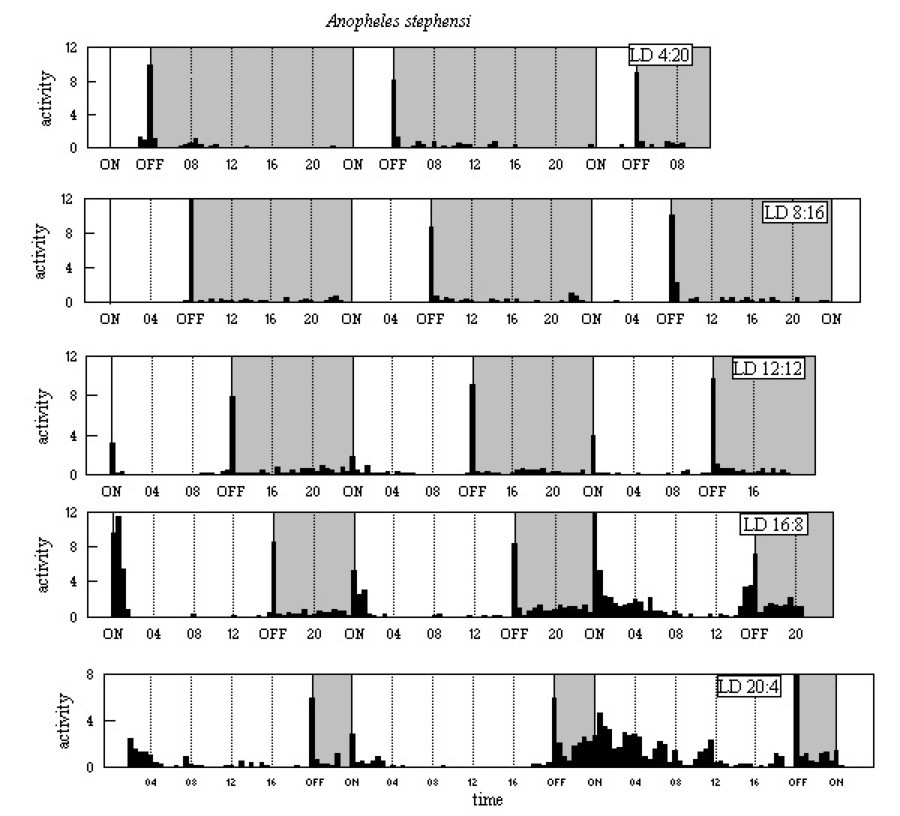
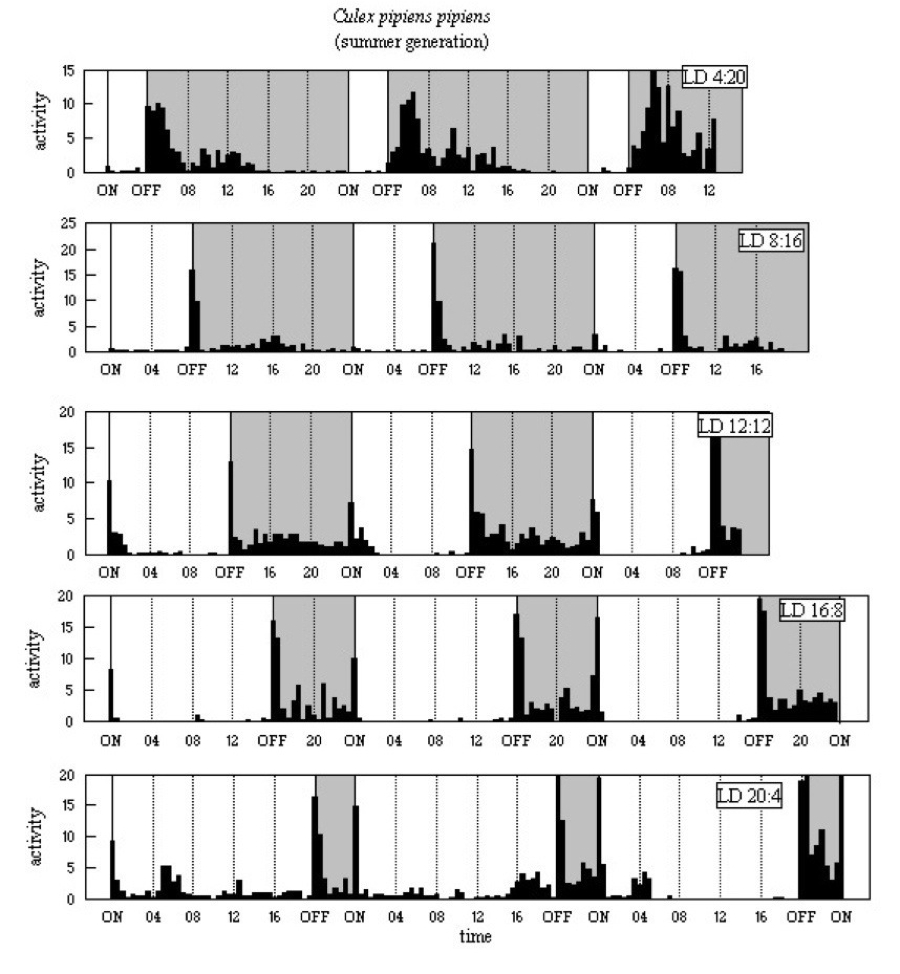
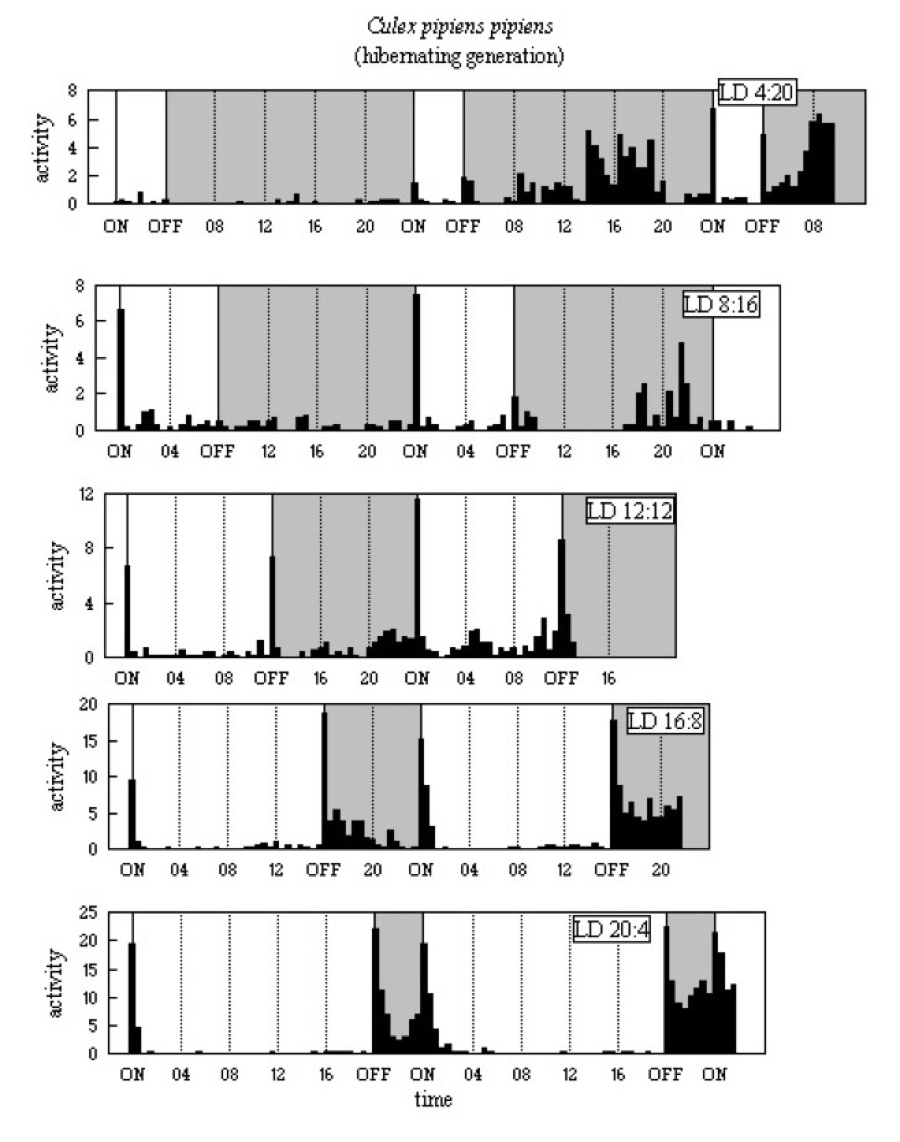
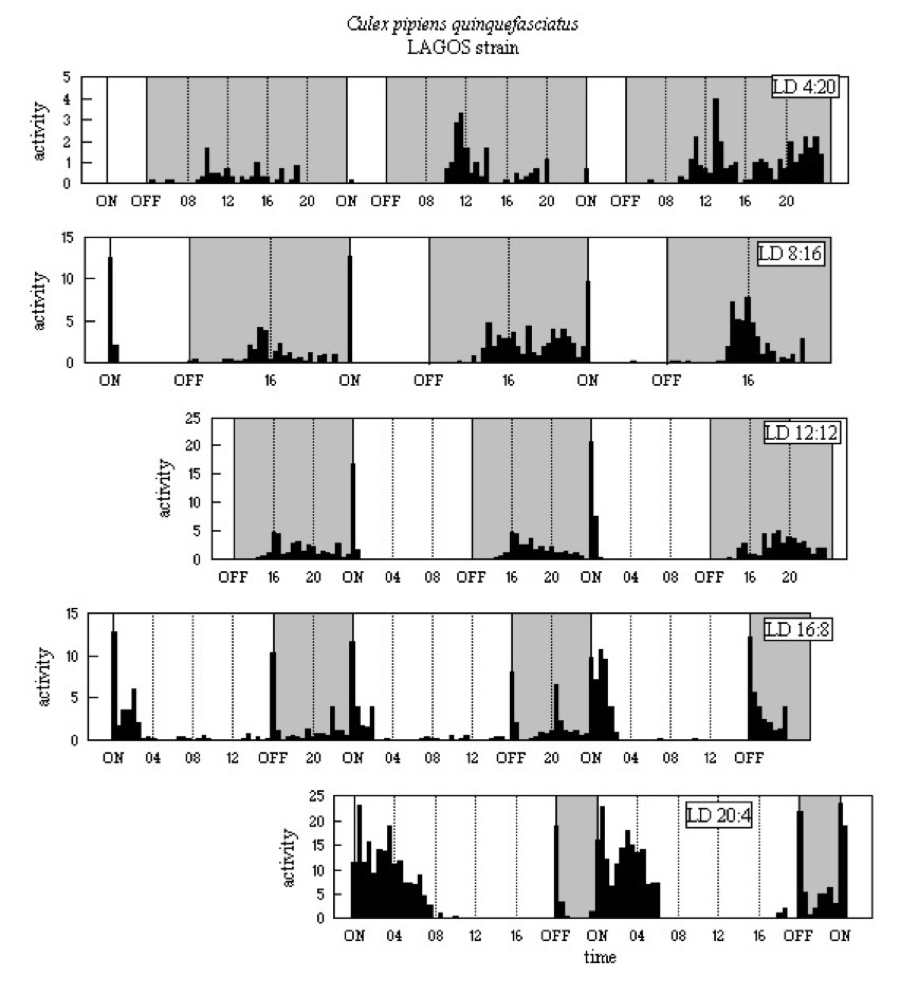
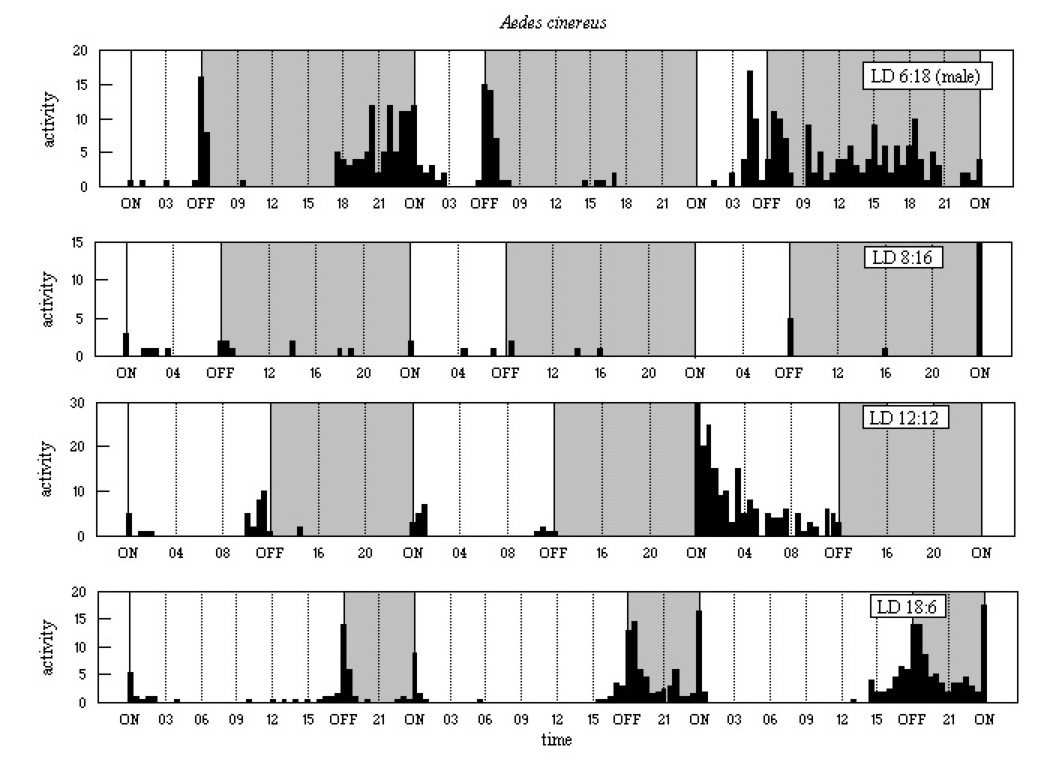
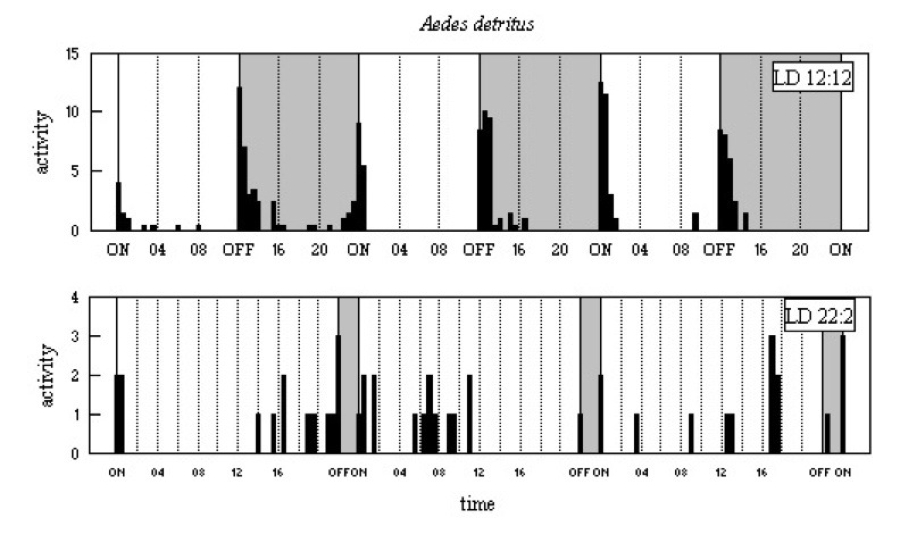
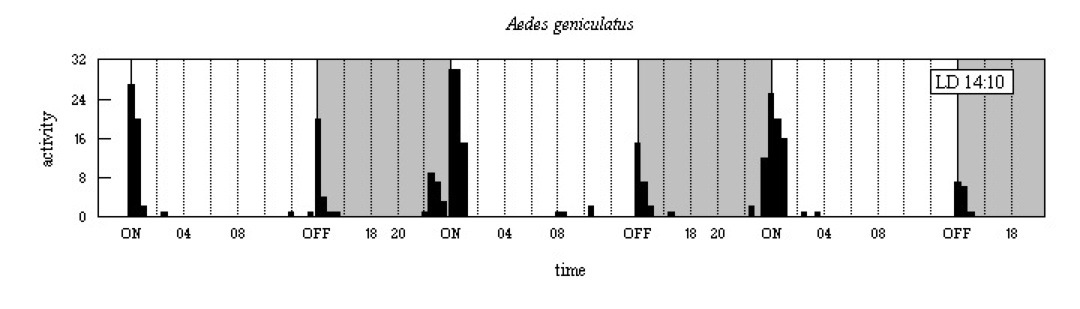
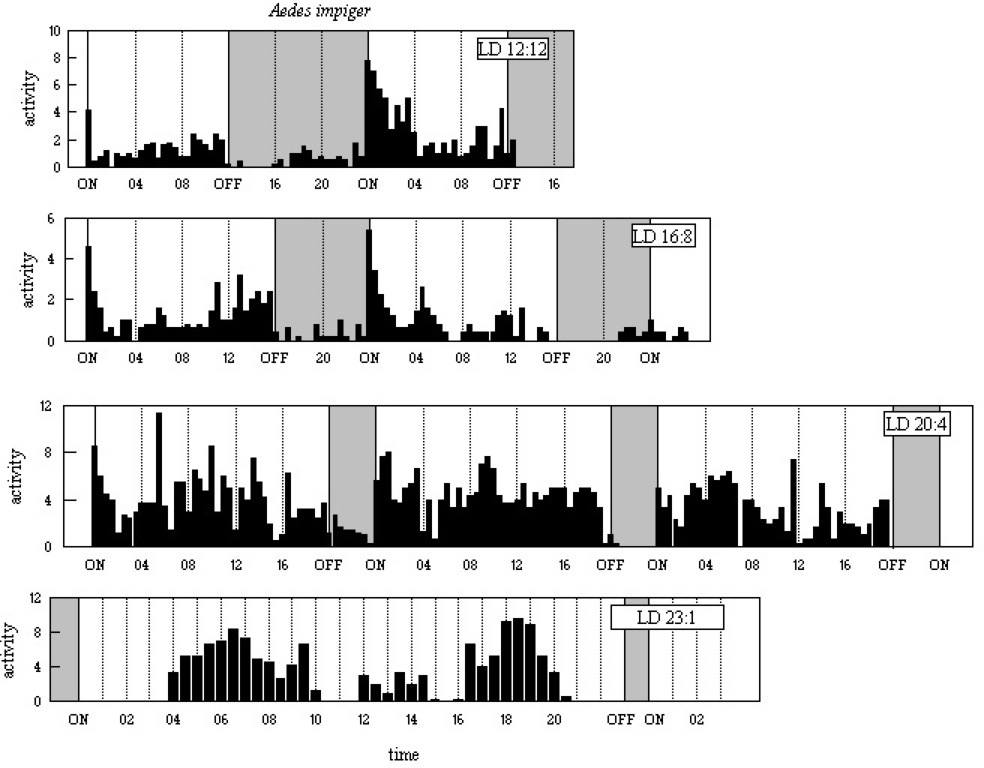
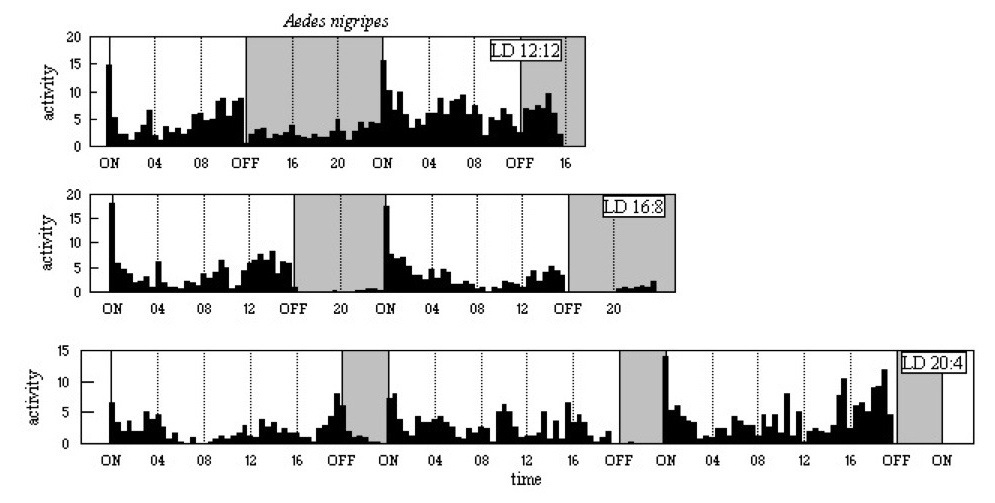
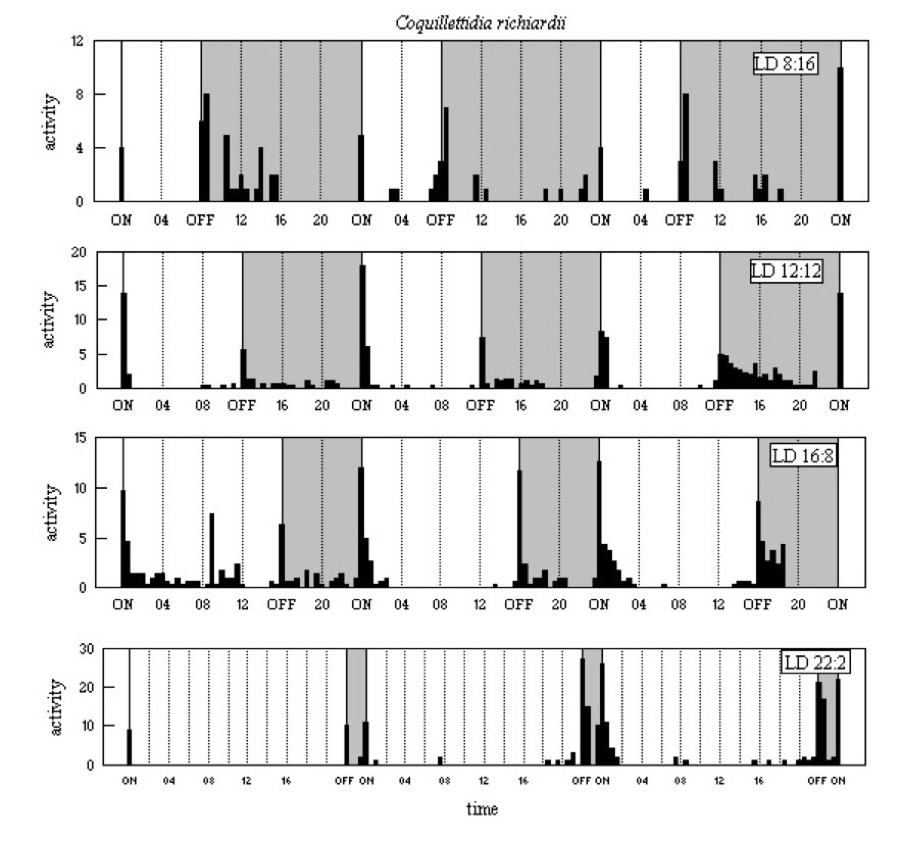
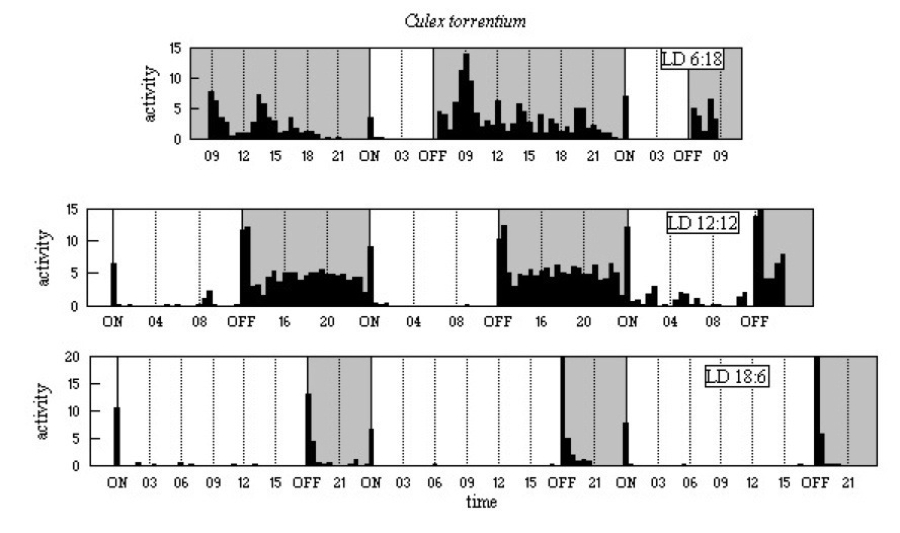
Flight activity of mosquitoes in a range of LD regimes. The Y-axis
shows the mean activity score per half-hour (maximum 30) for several
individuals (see text for numbers) and the time scale (X-axis) is
divided into half-hour intervals.
- Figure A1 Aedes aegypti, ssp. aegypti
LSHTM strain, flight activity in different LD regimes.
- Figure A2 Aedes aegypti, ssp. aegypti
Ilobi strain, flight activity in different LD regimes.
- Figure A3 Aedes aegypti, ssp. formosus
Bwamba strain, flight activity in different LD regimes.
- Figure A4 Aedes aegypti, ssp. formosus
West Nile strain, flight activity in different LD regimes.
- Figure A5 Aedes punctor
flight activity in different LD regimes.
- Figure A6 Anopheles atroparvus
flight activity in different LD regimes in different LD regimes.
- Figure A7 Anopheles farauti
flight activity in different LD regimes.
- Figure A8 Anopheles plumbeus
flight activity in different LD regimes.
- Figure A9 Anopheles stephensi
flight activity in different LD regimes; the LD 20:4 activity graph
starts from two hours after light-on.
- Figure A10 Culex pipiens pipiens,
summer generation, flight activity in different LD regimes.
- Figure A11 Culex pipiens pipiens,
hibernating generation, flight activity in different LD regimes.
- Figure A12 Culex pipiens
quinquefasciatus flight activity in different LD regimes.
- Figure A13 Aedes cinereus flight
activity in different LD regimes.
- Figure A14 Aedes detritus flight
activity in different LD regimes.
- Figure A15 Aedes geniculatus
flight activity in different LD regimes.
- Figure A16 Aedes impiger flight
activity in different LD regimes; activity in LD 23:1 was recorded for
only thirty hours.
- Figure A17 Aedes nigripes flight
activity in different LD regimes.
- Figure A18 Coquillettidia richiardii
flight activity in different LD regimes.
- Figure A19 Culex torrentium
flight activity in different LD regimes.
©1998, 2010 - Brian Taylor CBiol FSB FRES
11, Grazingfield, Wilford, Nottingham, NG11 7FN, U.K.
Comments to dr.b.taylor@ntlworld.com
|
href="\crhtml\figures.htm"